Archive for the ‘Distribution’ Category

Women’s Economic Empowerment and Control over Time in Sub-Saharan Africa (Nov 1-2)

Michael Stephens | October 29, 2021

November 1–November 2, 2021

The onset of the COVID-19 pandemic and the subsequent losses in lives and livelihoods are looming over Sub-Saharan Africa. As in the rest of the world, the pandemic has exposed the enduring inequalities and injustices in stark terms, including those based on gender and those intersecting with gender, such as economic deprivation. There is a growing realization that collective action to overcome the long-term and ongoing challenges requires greater engagements between researchers, civil society organizations, and policymakers. Accordingly, we are organizing a two-day virtual workshop that will feature research and policy discussions that address economic aspects of gender inequalities in Sub-Saharan Africa from various angles. Part of the research to be presented is work conducted by scholars at the Levy Economics Institute of Bard College in collaboration with scholars from Sub-Saharan Africa with the generous support of the Hewlett Foundation. The workshop will also highlight recent research by leading scholars in the region. The presentation of research will be accompanied by a free-wheeling exchange of ideas between scholars and participants. A policy roundtable with a select group of prominent members of the academic, policymaking, and civil society communities will conclude the workshop.

The workshop will be held between 13:00 and 15:30 (GMT) on November 1, 2021 and between 13:00 and 16:00 (GMT) on November 2, 2021.

This event is free and open to the public.

The complete schedule and information for participants is available below:

continue reading…

Comments


Higher Education in Brazil: Interrupted Inclusion?

Michael Stephens | June 4, 2020

by Ana Luíza Matos de Oliveira

Brazil is a highly unequal country — so is the access to its higher education system. However, in the beginning of the 21st century (2001-2015), there was a convergence between the profile of Brazilian higher education students and the Brazilian population in terms of income, race, and region, although many inequalities still exist. Now, this process might be at risk.

From 2001 to 2015, economic growth and improvements in the labor market affected families’ spending decisions. Also, the budget for higher education presented significant growth and many programs aiming at democratizing access to higher education in Brazil — such as Reuni (expansion of the federal higher education system), Prouni (offer of scholarships in private institutions), loan schemes for students, affirmative action, and student assistance — were created or broadened. Policies in partnership with the private sector were put in place and are related to a significant growth in enrollment in private institutions in this period.

This led to greater social inclusion in higher education, as Graph 1 demonstrates.[1] It is also important to state that during this period there was a policy of increasing the value of the minimum wage (MW), which in 2020 is now R$ 1045 (USD 205).

Graph 1 – Students in Higher Education according to per capita income – Brazil (2001-2015)


Source: A. L. M. Oliveira (2019)

Graph 2 shows a rising trend of participation in higher education among people from the bottom 70% of the Brazilian income distribution (per capita family income) and a decrease in participation among the richest 30%. However, there is a sign of reversal in 2015.[2] continue reading…

Comments


We Need Class, Race, and Gender Sensitive Policies to Fight the COVID-19 Crisis

Luiza Nassif Pires | April 2, 2020

Luiza Nassif-Pires, Laura de Lima Xavier, Thomas Masterson, Michalis Nikiforos, and Fernando Rios-Avila


Disproving the belief that the pandemic affects us all equally, data collected by New York City Department of Health and Mental Hygiene and a piece published today in the New York Times shows that the novel coronavirus is “hitting low-income neighborhoods the hardest.”[1] In a forthcoming policy brief, we share evidence that this pattern would be the case and provide a solid explanation as to why (Nassif-Pires et al., forthcoming). Moreover, as we argue, the death tolls are also likely to be higher among poor neighborhoods and majority-minority communities. This inequality in health costs is in addition to an unequal distribution of economic costs. In short, poor and minority individuals are disproportionately feeling the impacts of this crisis. A concise version of our evidence is presented here.

The toll of social inequality in healthcare is well known. A clear relationship has been repeatedly demonstrated between social determinants — such as income, education, occupation, social class, sex, and race/ethnicity — and the incidence and severity of many diseases. This association holds true for infectious respiratory illnesses such as influenza, SARS and also for COVID-19, as figure 1 shows. The consequences of this imbalance are particularly catastrophic when there is a massive disease outbreak. The precise mechanisms by which social determinants drive unequal disease burden during these outbreaks is harder to assess. On the one hand, there is a strong association of social determinants with clinical risk factors for respiratory illnesses such as chronic diseases, on the other, social aspects of poverty increase the risks of individuals contracting infectious diseases.

To establish the relationship between poverty and the clinical risk of a severe case of COVID-19, we estimate a health risk index as a function of poverty and percentage of minority population in neighborhoods of 500 cities. We use data from the 500 Cities project and from the American Community Survey. The risk index accounts for the incidence of chronic obstructive pulmonary disease, diabetes, coronary disease, cancer,  asthma,  kidney disease, high blood pressure, percentage of smokers, proportion of individuals with poor physical health and the proportion of the population that is above 65 years old. All data is available at the census tract level and results are presented in figure 1 and figure 2[2]. continue reading…

Comments


The Coronavirus Does Not Discriminate; Unfortunately Our Economic System Does

Thomas Masterson | March 27, 2020

In the last 24 hours, two big news stories regarding the economic impact of the Covid-19 pandemic have broken. The first is news that the Senate has passed a $2 trillion stimulus package that legislators claim is intended to alleviate the economic damage caused by the responses to the unfolding pandemic: closures of schools and businesses as well as the social isolation of much of the population. The second–a reported 3 million new unemployment claims in the last week alone–is a direct result of the aforementioned responses, as businesses close, events and travel plans are canceled and those who can remain isolated in their homes wondering which will run its course first: the supply of binge-able content on Netflix or the pandemic.

continue reading…

Comments


Basic Income and the Job Guarantee

Michael Stephens | June 8, 2016

Pavlina Tcherneva was interviewed by Joe Weisenthal yesterday to present the case against a universal basic income policy (a proposed version of which was just voted down in Switzerland). Watch:

Thcerneva Weisenthal_Basic Income v Job Guarantee

Tcherneva has written about the UBI versus Job Guarantee debate, including this contribution (pdf) to a special issue of the journal Basic Income Studies (paywall).

She also spoke about this last November at a roundtable convened by Dissent magazine:
continue reading…

Comments


Is Economic Inequality Immoral?

Michael Stephens | September 7, 2015

Harry Frankfurt, whose formal concept of “bullshit” is indispensable to both professional and everyday life, recently published an article for Bloomberg View arguing that (1) economic (income and wealth) inequality is, in and of itself, morally insignificant and (2) “egalitarianism” (being concerned about economic inequality in and of itself) is harmful. The article is an excerpt from a book he has coming out at the end of the month.

According to Frankfurt, egalitarianism is loosely based on the belief that “the possession by some of more money than others is morally offensive.” This belief is false, he says, and it leads us astray. Frankfurt suspects that what most of us are really — and justifiably, in his view — reacting to when we express moral reservations about inequality is the potentially abject condition of those lower down the income distribution; not simply because there are others who have more, but rather if those in the lower income or wealth percentiles do not have enough resources to achieve some substantive standard of well-being (“not a relative quantitative discrepancy but an absolute qualitative deficiency”). In other words, it is poverty, or, more broadly, the condition of not having “enough,” that is morally significant, rather than monetary inequality per se:

“Mere differences in the amounts of money people have are not in themselves distressing. We tend to be quite unmoved, after all, by inequalities between those who are very well-to-do and those who are extremely rich. The fact that some people have much less than others is not at all morally disturbing when it is clear that the worse off have plenty.”

Frankfurt goes further: not only is egalitarianism based on a false belief, it is itself morally disorienting. Being overly focused on other people’s incomes — on the mere quantitative relationships between incomes — he argues, interferes with our ability to determine our own substantive economic needs and interests. (“A preoccupation with the condition of others interferes, moreover, with the most basic task on which a person’s selection of monetary goals for himself most decisively depends. It leads a person away from understanding what he himself truly requires in order to pursue his own most authentic needs, interests, and ambitions.”)

From this perspective, it would seem to follow that a great deal of economic research on patterns of income or wealth distribution not only dwells on morally insignificant issues but, to the extent it is motivated by egalitarian concerns or draws public attention to supposedly trivial monetary differences, such work “contributes to the moral disorientation and shallowness of our time.” In fact, if we buy all this, we might even be compelled to say that income distribution research is less significant (and more harmful) than ever these days, since, as those who study the US distribution have pointed out, so much of the action lately is focused on the increasing distance between the top 1 percent and all the rest (or even the top 0.01 percent).

What should we say about this?

First, even if we grant Frankfurt everything he argues for, this would not necessarily require us to disregard economic inequality or do nothing to remedy it. There are other reasons to worry about inequality. There is, for instance, a macroeconomic case. Papadimitriou, Nikiforos, Zezza, and Hannsgen argue that the growing disparity in the US income distribution has been a major contributor to financial instability and threatens the sustainability of economic recovery. There are also normative political reasons for being concerned about excessive amounts of wealth and income being concentrated in the hands of the few. So even if we’re persuaded by Frankfurt, we would have to weigh these other considerations (macroeconomic, political, social, and so on) against the moral harm he believes results from preoccupation with income differences.*

Second, the implications of Frankfurt’s argument are not necessarily as conservative (for lack of a better term) as some might imagine. continue reading…

Comments


Folbre on the Consequences of Ignoring Unpaid Work

Michael Stephens | August 31, 2015

Nancy Folbre, who recently joined the Levy Institute roster as senior scholar, was interviewed by Dollars & Sense on the topic of how conventional economics and policymaking deal with (or rather, fail to deal with) household and caring labor:

D&S: What is the practical consequence of not measuring household labor and production? Are economic policies and institutions different, especially in their impact on women, than what they would be if household labor were fully reflected in statistics on total employment or output?

NF: One macroeconomic consequence is a tendency to overstate economic growth when activities shift from an arena in which they are unpaid to one in which they are paid  (all else equal). When mothers of young children enter paid employment, for instance, they reduce the amount of time they engage in unpaid work, but that reduction goes unmeasured. All that is counted is the increase in earnings that results, along with the increase in expenditures on services such as paid childcare.

As a result, rapid increases in women’s labor force participation, such as those typical in the United States between about 1960 and the mid-1990s, tend to boost the rate of growth of GDP. When women’s labor force participation levels out, as it has in the United States since the mid 1990s, the rate of growth of GDP slows down. At least some part of the difference in growth rates over these two periods simply reflects the increased “countability” of women’s work.

Consideration of the microeconomic consequences helps explain this phenomenon. When households collectively supply more labor hours to the market, their market incomes go up. But they have to use a substantial portion of those incomes to purchase substitutes for services they once provided on their own—spending more money on meals away from home (or pre-prepared foods), and child care. So, the increase in their money incomes overstates the improvement in their genuinely disposable income.

A disturbing example of policy relevance emerges from consideration of the changes in public assistance to single mothers implemented in the United States in 1996, which put increased pressure on these mothers to engage in paid employment. Many studies proclaimed the success because market income in many of these families went up. But much of that market income had to be spent paying for services such as child care, because public provision and subsidies fell short.

The rest of the interview is posted here at the Triple Crisis blog.

The LIMTIP (Levy Institute Measure of Time and Income Poverty) team has done extensive empirical work around this sort of framework, in which the time and/or money required to meet household production needs is integrated into an assessment of economic well-being — with the aim of providing a clearer picture of the depth and breadth of poverty in many countries.

Comments


A Cycle of Financial Fragility?

Greg Hannsgen | June 3, 2015

Untitled

(click image above to enlarge)

Can a bull market founded largely on credit survive? A forthcoming Levy Institute working paper I wrote with Tai Young-Taft of Bard College at Simon’s Rock (link for those interested) represents an attempt to deal with the role of financial instability—along with other sources of economic fluctuations—in the dynamics of the economy. Here, I’ll focus mostly on the role of margin loans that are used by many investors and traders to leverage positions in stock. The model developed in the paper includes a role for several policy tools that might be used in attempts to stabilize the economy: a fiscal-policy rule with public production and unemployment rate targets, along with public-sector R&D, financial supervision and regulation, and a target for the inflation-adjusted interest rate on government debt.

Now, for the current situation. The figure above highlights one potential threat to stability designed to arise spontaneously in runs of the model: surges in the use of margin debt to finance investments in stock. The chart shows that the amount of such debt outstanding in the US relative to GDP rose sharply during the tech bubble and the period leading up to the financial crisis and recession of 2007–09, achieving a new peak each time. Subsequent financial market collapses led to cyclical declines in the use of this form of leverage. On average, for the first quarter of 2015, this ratio stood at more than .028, suggesting that the stock market’s vigor again rests to a great extent on heavy borrowing (see figure). (Moreover, some different but closely related uses of credit, such as bond issues that wind up financing stock buybacks, have also contributed to the post-recession bull market.) This column from the New York Times’s Floyd Norris from a couple of years back discussed evidence that margin-credit cycles helped fuel cyclical movements in stock prices and the economy. His column displayed a longer but now outdated margin loan series.

In the model, margin loans can generate positive feedback effects: a cycle of increasing margin loan balances and rising stock prices, or vice-versa.  The story is similar to that of the “levered losses” in housing that took place in a number of countries earlier in this decade (see the recent book House of Debt for one account of the story, although even in this version of the story, I am inclined to see excessive optimism about the usual cure by wage and price adjustments); indeed, big, unsustainable run-ups in asset prices tend to be driven at least in part by credit booms. The situation shown in the figure is only one of many somewhat worrisome signs of market fragility. At the moment, fragility generally seems to be manifested most clearly in big increases in the quantities of various assets and liabilities relative to flow variables such as income and GDP, rather than in yield data.

More on the new paper and the model in it, for those inclined to look into it: continue reading…

Comments


How Do We End the Inequality Feedback Loop?

Michael Stephens | April 7, 2015

“As Hyman Minsky argued, there are many varieties of capitalism, some more stable than others—and, we can add, some more equitable than others.” — Pavlina Tcherneva

Pavlina Tcherneva has revisited her (in)famous inequality chart, which showed an ever-rising majority of the income growth during post-1970s economic expansions being captured by the wealthy (specifically the top 10 percent of income earners). In a recently released policy note, “When a Rising Tide Sinks Most Boats: Trends in US Income Inequality,” she has updated the numbers through 2013 and broken down the top decile further (top 1 percent and 0.01 percent), compared the results of including or excluding capital gains, and looked at what happens to the distribution of income growth when we expand our scope to the entire business cycle (Tcherneva looks at NBER-dated GDP cycles as well as “income cycles” based on real income data from Piketty and Saez).

Here are some of the results:

  • The capital gains discussion yields a somewhat counterintuitive result: when you exclude capital gains, the distribution of income growth between the top 1 percent and bottom 99 percent appears more unequal. Tcherneva explains that this is because even though the bottom 99 percent have barely any capital gains income to speak of (2 percent of their income), their shrinking wage incomes meant that, from 2009-13, these meager capital gains were making the difference between declining (excl. cap gains) and merely stagnating (incl. cap gains) incomes for the bottom 99 percent.
  • When we look at entire economic cycles (peak-to-peak GDP or peak-to-peak income) rather than just the expansion periods, the picture doesn’t look any better. In fact, it’s worse. As Tcherneva notes, although the wealthy tend to lose disproportionately more of their income very early on during downturns, they recover faster and stronger than the bottom 90 percent: “Since the ’70s, when we look at the period beginning only one year after a downturn [and ending at the subsequent peak of the income cycle], the cycle delivers between 78 percent and 107 percent of the income growth to the wealthiest 10 percent of families.” In other words, she writes, “the way we grow recovers the incomes of the top 10 percent first.”
  • She also includes the chart below, which, though not quite as striking at first glance, becomes even more galling as you let it sink in. The chart shows the shares of income growth captured by the bottom 99.99 percent and the top 0.01 percent. By contrast with the other charts (90 percent vs. 10 percent and 99 percent vs. 1 percent), the blue bar is still bigger than the red, but keep in mind we’re talking about a tiny fraction of a fraction of the population in that red bar — around 16,000 families — and as you can see, they gobbled up practically one-third of all the income growth in the last full expansion period (2001-07), with the same worrying trend suggesting itself.

Tcherneva_Levy Institute_When a Rising Tide Sinks Most Boats_Fig3

Tcherneva also comments on the need to reorient our broader policy approach (such that it exists) to combating inequality. One of the points she makes is that we give up too much terrain when we focus disproportionately on raising top marginal income tax rates. continue reading…

Comments


What’s Wrong with David Leonhardt’s NYT Piece on Inequality?

Pavlina Tcherneva | February 20, 2015

The New York Times made waves this week with another piece on inequality, saying that it has not risen since 2007. The article was based on this paper by GWU’s Stephen Rose.

The article also suggests that expansions are not a good way of looking at trends in inequality (as I have done in the past, also covered by the NYT). Instead, one needs to look at the business cycle. It also concludes that, thankfully, because of government tax and transfer policies, inequality has not been “that bad” over the last few years and governments can clearly do something about it.

So what’s wrong with this picture?

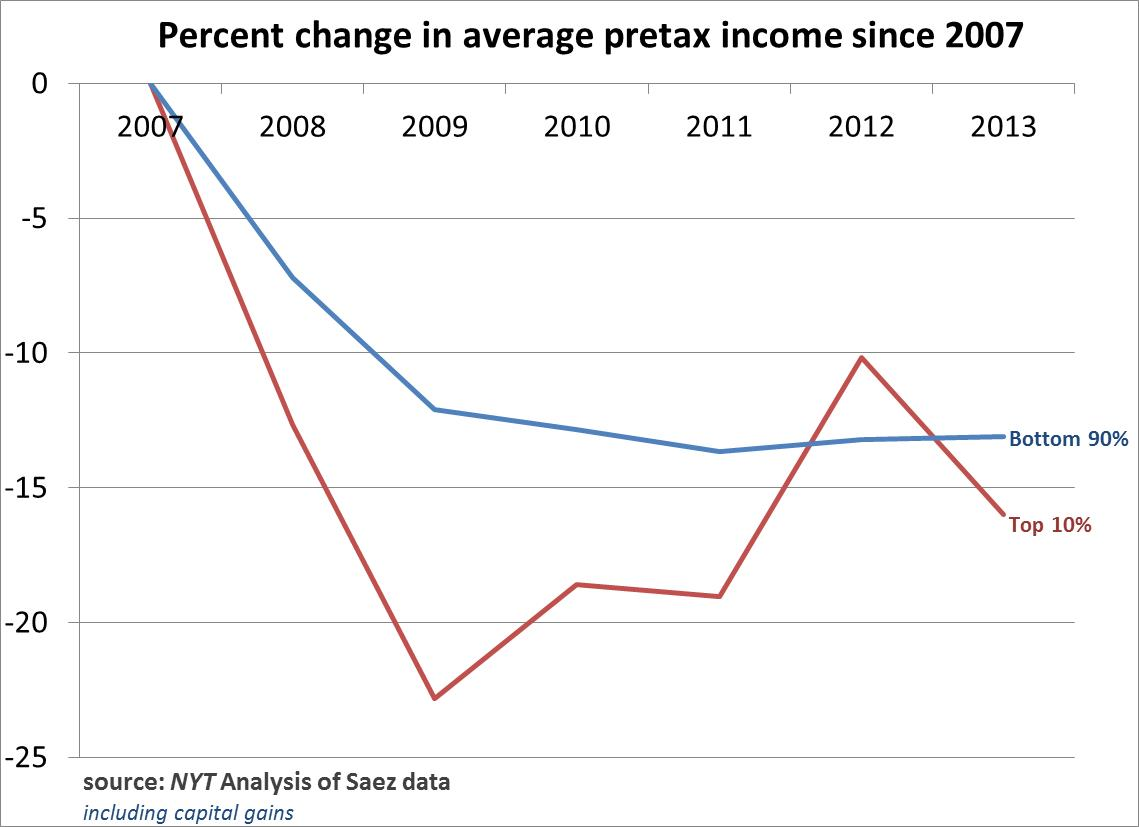
Here is the graph that appeared in the NYT (I’ve reproduced it below showing only the bottom 90% and top 10% of families using the same Saez data).
Tcherneva_NYT1

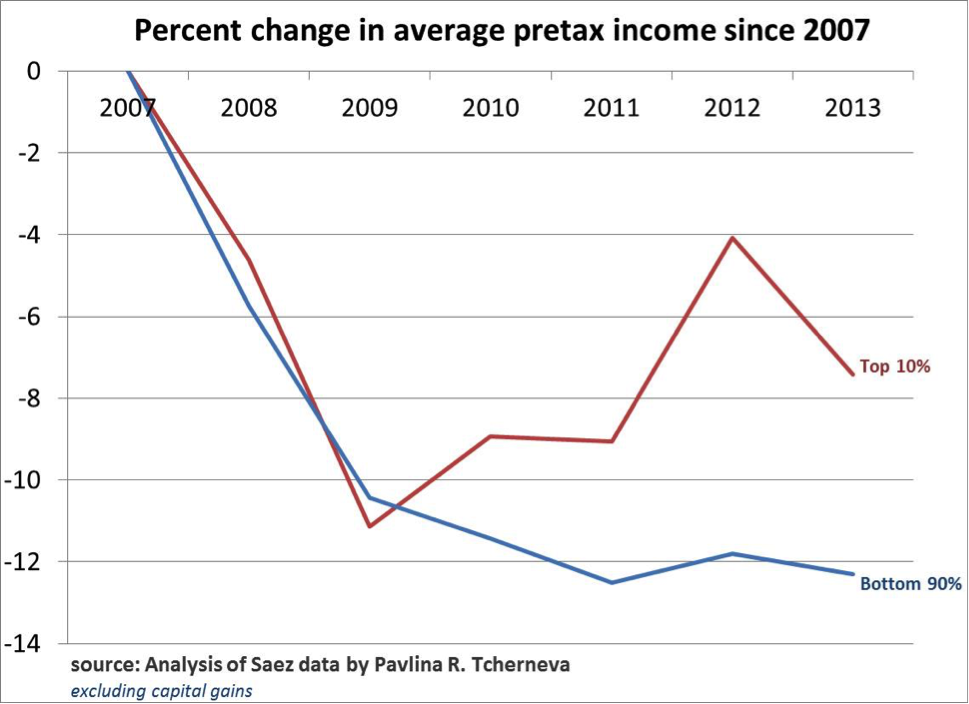
Now let’s reproduce the exact same graph, using the same data but excluding capital gains. The trends reverse. The bottom 90% of families have lost proportionately more than the top 10% since 2007.
Tcherneva_NYT2

Now, I am not fond of excluding capital gains (I am in favor of annuitizing them), because they are very important to income dynamics, but still, without capital gains, the bottom 90% lose proportionately more (relative to the top 10%) than with them.

In any case, if we include the top 1% and the 0.01% in the above two charts, one would find that they do lose proportionately more including or excluding capital gains.

However, the bottom line is this: this exercise gives an extremely narrow look at income distribution trends, based on a very incomplete picture. As Nick Bunker from the Washington Center for Equitable Growth put it:

“Reasonable people can disagree about the best benchmark. But what isn’t reasonable is using a peak as a benchmark to claim inequality hasn’t increased over an incomplete business cycle.”

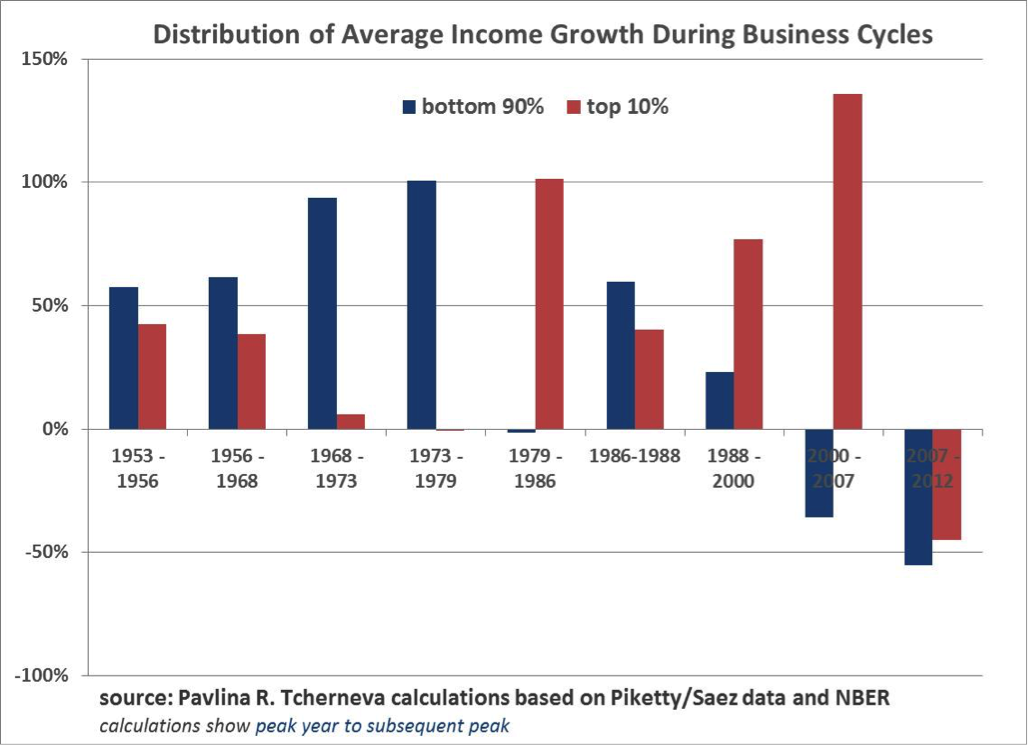
So let’s look at complete business cycle data. The following chart shows how the distribution of income growth has evolved from one peak to another.
Tcherneva_NYT3

There is a clear shift in trend after the ’80s. During 3 out of the last 4 complete business cycles, the wealthy 10% have gotten a proportionately greater share of the growth. And in the last full business cycle (2000-2007), they got all of the growth, while incomes of the bottom 90% fell. Yes, since 2007, both groups shared the losses about equally, but why should we be surprised that the top 10% shouldered 45% of the decline? (Again, this is not a complete business cycle yet!)

We live in a casino economy driven by serial asset bubbles, where the incomes of the wealthy (and not just their capital gains) are increasingly tied to stock market performance.

So when the biggest bubble in human history popped, the wealthy families lost a ton of income. At the same time middle class households fell into poverty, lost their decent jobs and pay, and got unemployment insurance or food stamps from the government. Can one really conclude from this that inequality is not “that bad”?

As an example, inequality will not be “that bad” if one person in the US earned 100% of all the national income, and then the ‘evil government’ (or ‘benevolent dictator’; take your pick) decided to tax most it and then gave transfers to the rest. But is this the kind of ‘better’ income distribution that we are aiming for? Aren’t we all talking about an economy where most people have decent jobs, decent wages, decent salary growth prospects, and a decent chance to participate and share in that growth?

There are many ways to slice and dice this data.

I have looked at expansions because they answer a very specific question: Once the economy returns to some normalcy and promises to deliver prosperity, to whom does it keep its promise? And the answer is, increasingly to the top 10%.

The problem with the NYT article is not the inequality chart, even though it shows an incomplete and thus misleading business cycle picture. The problem is the conclusion: that ‘taxes’ and ‘transfers’ are the solution to the deep structural economic problems that are causing the generation and distribution of incomes to be so inequitable from the very outset.

So the next time someone tells you that “a rising tide lifts all boats,” you can respond “no, increasingly it sinks most.”

(cross-posted from New Economic Perspectives)

Comments