Archive for the ‘Commodity Price Inflation’ Category

On Financial Transaction Taxes and Nonsense-Powered Economic Headwinds

Michael Stephens | February 25, 2013

Randall Wray joined Suzi Weissman on her “Beneath the Surface” radio show on Friday.  They began the interview with a discussion of the policy blunders that are creating headwinds for the US economy, including the expiration of the payroll tax cut, the decline of real per capita government spending, and, as Wray put it, “the government sucking jobs right out of the economy.”  He’s not referring here to the walking corpse of the theory that regulatory uncertainty is to blame for the slow recovery, but to the fact that government is holding back job growth far more directly: by laying off workers at an unprecedented rate.  For context, look at this chart put together by Floyd Norris (highlighted):

Economix_Unprecedented Public Job Losses_Highlighted

They also addressed this Marketplace segment on the “death of inflation,” ongoing threats from the financial system, and some ideas for financial reform that are currently being tossed around.  On the latter, Wray argued that the idea of a financial transactions tax (being considered by a number of EU countries) is a second-best or partial solution.  Instead of sin taxes and other such “economists’ solutions,” as he described them, Wray recommended coming at the problem more directly: by outlawing certain speculative activities and going after practices like high-frequency trading.  They closed with a discussion of the prospects of another financial crisis emerging.

Listen to the interview here.

Comments


MMT, Argentina, and Views on Inflation

L. Randall Wray | October 9, 2012

On the surface, the data from Argentina look awfully good—among the top performers in the world over the past decade. And she’s apparently done it without a run-up of either private sector or government sector debt. In other words, Argentineans have bucked the trend among developed countries, that saw (mostly) tepid growth fueled almost entirely by debt.

And that seems to be at least in part due to a policy choice. Argentina had been the poster child for Neoliberal policies all through the 1990s—they adopted virtually the whole Neolib agenda lock-stock-and-barrel. They even adopted a currency board. And unlike Euroland (which also adopted something like a currency board as each member adopted a foreign currency—the euro), Argentina would have consistently met the tight Maastricht criteria on budget deficits and debts over that period. The main purpose of the austere budgets and currency board constraints was to kill high inflation. It worked. But, over that period unemployment grew and GDP growth was moderate. I won’t go further into the problems encountered at the turn of the new decade but the whole thing collapsed into a severe economic, financial, and political crisis. In a last desperation move, the government abandoned the currency board (or, you could say the currency board abandoned the government!), defaulted on its debt, and created a Jobs Guarantee program called Jefes.

(You can read more here and here; or if you want a first-hand account by Daniel Kostzer who played a major role in bringing Argentina out of crisis by helping to create and implement the Jefes program, read this.)

Starting from the depths of a horrible recession, then, Argentina climbed back to recovery—not only making up for ground lost in the downturn, but also in many ways by rectifying problems created by the Neoliberal experiment. continue reading…

Comments


A Cautionary Note about Stagflation in the 1970s

Greg Hannsgen | August 15, 2012

For those who worry that elevated federal deficits and quantitative easing (QE) by the Fed will lead to high inflation, a word about the macroeconomics of the 1970s. The topic came up in the news recently with the passing of economist and former presidential adviser Paul McCracken. In keeping with many orthodox accounts of the era, an obituary in the New York Times cast much of the blame for the stagflation [slow growth combined with high inflation] of the 1970s on “Keynesian” macro policies, in particular large budget deficits:

A wide-ranging thinker, Mr. McCracken was part of a postwar generation of economists who believed that government should play an active role in moderating business cycles, balancing inflation and unemployment, and helping the disadvantaged.

His nearly three years at the White House coincided with a turbulent era marked by rising deficits, rampant inflation, the imposition of wage and price controls, and the breakdown of the system of fixed exchange rates that had governed the world’s currencies since World War II.

As a result, by the early 1980s, Mr. McCracken, like other economists, questioned the Keynesian assumptions that had been dominant since the war. He concluded that high inflation had resulted from “a cumulative paralysis in our will” and called for greater fiscal discipline to limit the growth of government spending — a topic that continues to vex Washington….

Working for Nixon, Mr. McCracken was confronted with an inflation rate that had been rising since 1965, a byproduct of the deficits that the federal government had amassed during the Vietnam War…..

The article paints a picture in which McCracken stood in the middle ground between Keynesian “fine-tuners” of macro policy on the one hand and opponents of “activist” policies, such as Milton Friedman, on the other, who blamed inflation on excessive government spending and erratic growth in the money supply.

The view represented by the Times article is far from the only reasonable account of the causes of the stagflation of the 1970s, in particular the episodes during which the US experienced double-digit inflation (see figure below, in which year-over-year CPI inflation is shown in blue). continue reading…

Comments


Can We Afford the Usual?

Greg Hannsgen | July 19, 2012

With yesterday’s quarterly BLS data release on “usual weekly earnings” out, I have once again constructed some “alternative” measures of real wages, based on price indexes for food commodities at the wholesale level. The commodity-based indexes are depicted in the figure above with lines in various colors. Compared to the more typical measure of real, or inflation-adjusted, earnings, which is seen in black, the food-commodity wages may be of interest in different contexts: for consumers who spend relatively large portions of their budgets on food, for example, or to those following the debate over the unfortunate SNAP (food stamp) cuts in the farm bills recently passed by the Senate and the House Agriculture Committee (see this earlier post). Inflation at the wholesale level is sometimes a harbinger of similar trends in prices paid by consumers at retail stores, so the series shown above may be most helpful as indicators of possible future trends in the standard of living.  Along these lines, the Financial Times reports that prices for food commodities will be higher this decade than last, according to two major forecasters.  The cited reasons for the expected rise in food-commodity prices include an expected upward trend in the price of oil, climate-related crop failures, and demand from emerging economies.

It is best, given that the data are not seasonally adjusted, to look at changes compared to the second quarter in another year. Also, since the commodity-price indexes are rather volatile, changes over fairly long periods are most informative. The second-quarter “real” wage results, relative to the second quarter of 2010, are: in terms of a broad BLS price index, -1.5 percent; fresh and dry vegetables, +10.6 percent; fresh and dry vegetables, +24.0 percent; grains, -38.6 percent; slaughter livestock, -16.0 percent; slaughter poultry, -3.2 percent; raw milk, -4.6 percent; chicken eggs, -14.5 percent; and hay, hayseeds, and oilseeds, -33.1 percent.  The results for the past year have been a bit better, with five of the eight commodity-wages rising, along with the BLS’s broad real measure, which has risen .3 percent over its second quarter 2011 level.

Update, July 20: I forgot to point out that the run-up in grain prices that I mentioned in Spring and Fall 2011 posts appears to have ended (see purple line) in the data shown in the figure; meanwhile however, certain grain prices are in fact rising rapidly again. As a matter of fact, the Financial Times reported again on commodity prices today, this time on its front page. In a report noting that soybean and corn prices reached record highs in commodities markets yesterday, it observes that the world is facing a new “food crisis,” owing largely to the drought currently affecting crop yields in the United States.

Comments


Wray on the Commodities Bubble and the Coming Crash

Michael Stephens | September 30, 2011

“The problem is that we have way too much money chasing way too few good assets. The total amount of financial bets out there is way over $600 trillion around the world. There just aren’t enough good investments to absorb that amount of money. So, what happens is they blow up–one asset after another. Then, those inevitably crash.”  Jumping off from his latest post, Randall Wray was interviewed at Benzinga regarding his arguments about a commodities bubble and the potential for a new crash.

Wray suggests in this interview that, in the face of another crisis, Washington may be constrained in its ability to come to the rescue as it did in 2008:

The Dodd-Frank legislation makes it very difficult to repeat that performance. I’m not saying that they won’t find a way around the rules, or they won’t find a way to do it again. They might, but it’s going to be very politically unpopular. I’m not sure they are going to be able to do it again.

Once prices start tumbling, all of the asset markets are actually linked. Even though it’s not obvious, they really are. It will tumble across all of them. And it’s not clear that we will be able to stop it this time. At least, not as easily as last time.

Comments


Commodities Bubble Reax

Michael Stephens | September 23, 2011

Wray responds to critics of yesterday’s post, and includes an excerpt from his policy brief on the topic (for a more condensed version, highlights of the brief are here).

Comments


The Biggest Speculative Bubble of All

L. Randall Wray | September 22, 2011

(Cross posted from EconoMonitor)

Back in fall of 2008 I wrote a piece examining what was then the biggest bubble in human history: http://www.levyinstitute.org/pubs/ppb_96.pdf.

Say what? You thought that was tulip bulb mania? Or, maybe the NASDAQ hi-tech hysteria?

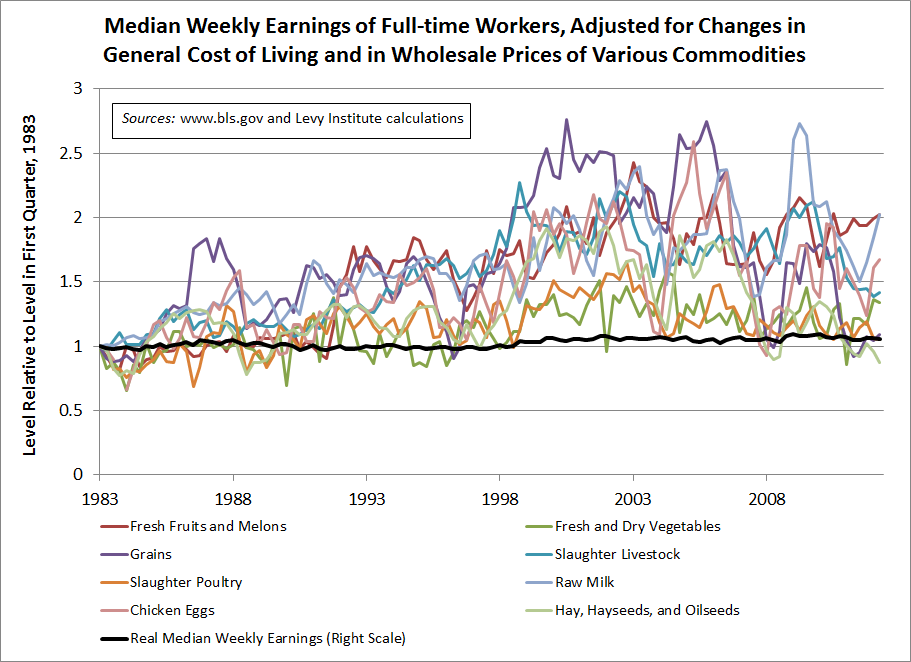
No, folks, those were child’s play. From 2004 to 2008 we experienced the biggest commodities bubble the world had ever seen. If you looked to the top 25 traded commodities, you found prices had doubled over the period. For the top 8, the price inflation was much more spectacular. As I wrote:

According to an analysis by market strategist Frank Veneroso, over the course of the 20th century, there were only 13 instances in which the price of a single commodity rose by 500 percent or more. For example, the price of sugar rose 641 percent in 1920, and in the same year, the price of cotton rose 538 percent. In 1947, there was a commodities boom across three commodities: pork bellies (1,053 percent), soybean oil (797 percent), and soybeans (558 percent). During the Hunt brothers episode, in 1980, silver prices were driven up by 3,813 percent. Now, if we look at the current commodities boom, there are already eight commodities whose price rise had reached 500 percent or more by the end of June: heating oil (1,313 percent), nickel (1,273 percent), crude oil (1,205 percent), lead (870 percent), copper (606 percent), zinc (616 percent), tin (510 percent), and wheat (500 percent). Many other agricultural, energy, and metals commodities have also had large price hikes, albeit below that threshold (for the 25 commodities typically included in the indexes, the average price rise since 2003 has been 203 percent). There is no evidence of any other commodities price boom to match the current one in terms of scope.

Now here’s the amazing thing about that bubble. The staff of Senator Joe Lieberman and Representative Bart Stupak wanted to know whether the bubble was just due to “supply and demand”. Relying on the expertise of Frank Veneroso and Mike Masters (two experts on the commodities market), I was able to conclude beyond any doubt that it was a speculative bubble driven by a “buy and hold” strategy adopted by managers of pension funds. Hearings were held in Congress, with guys like Mike Masters testifying as well as representatives from the airlines and other industries.

The pension funds panicked, realizing that their members would hold them responsible for exploding prices of gasoline at the pump. Pension funds withdrew one-third of their funds and oil prices fell from about $150 per barrel to $50. If you want to read the detailed analysis, go to my paper cited above—it has to do with commodities indexes, strategies pushed by your favorite blood sucking vampire squid (Goldman Sachs), and futures contracts. It gets wonky. To make a long story short, the bubble ended in fall of 2008.

But then the crisis wiped out real estate markets and the economy. Managed money needed another bubble. They whipped up irrational fears of hyperinflation that supposedly would be caused by Helicopter Ben’s QE1, QE2, and the newly announced QE3. Better run to good “inflation hedges” like gold and other commodities. That did the trick. The commodities speculative bubble resumed.

And boy, oh boy, what a boom. continue reading…

Comments


Should the Dollar Remain Independent of Gold?

Greg Hannsgen | July 1, 2011

(Click figure to enlarge it.)

Some “gold bugs” advocate a return to the gold standard, which the United States officially abandoned in the early 1970s.  The annual data in the chart above show that the price of gold has risen sharply in both euros and yen since 1999. Meanwhile, the dollar itself has fallen against both of the currencies, as shown by the lines near the bottom of the chart. Easy monetary policy has played a role in this drop. But a weakening currency has been one factor behind the recent increase in U.S. exports. The latter grew more than imports in percentage terms over the period shown in the figure. But nonetheless, both imports and exports grew by over 40 percent. It would have been difficult to increase exports at all with U.S. goods and services priced in a surging gold-backed currency.

It goes without saying that the price of gold could possibly fall rather than rise in coming years. But dealing with a commodity money whose value can abruptly change in ways that harm the economy is always a severe drawback of a currency backed by gold. Of course, if the United States had adopted a gold-backed currency in 1999, U.S. wages, prices, etc. would likely have behaved much differently than they did. Hence, one cannot be sure what the outcome of a switch to the gold standard would have been.  But these other changes could also easily have been detrimental to the health of the U.S. and world economies.

Comments follow:
continue reading…

Comments


How much food will a week’s earnings buy?

Greg Hannsgen | April 6, 2011

(Click graph to expand.)

Recent months have seen double-digit increases in energy prices and the prices of many important agricultural commodities. Because of the recent inflation in various raw materials, fuels, and foods, many ordinary Americans have been finding it increasingly difficult to afford basic necessities. The figure above shows just how severe this trend has been. (You will probably need to click on the image to make it larger.)

The lines for various commodity groups begin on the left side of the figure at a level of zero percent for the March 2006 observation. Each subsequent point on a given line shows the total percentage change since March 2006 in the amount of one type of farm product that can be purchased at the wholesale level with the average weekly paycheck. The dark blue line that appears nearly flat shows average real (inflation-adjusted) weekly earnings as reported by the government. The Bureau of Labor Statistics (BLS) uses the consumer price index (CPI-U) to deflate this series. The line shows that the purchasing power of wages for a typical job has increased by only about 2.2 percent over the five-year period shown in the figure. Moreover, ground has been lost since early last fall, when wages were as high as 3.3 percent above March 2006 levels.

The other lines in the figure refer to average nominal weekly earnings deflated by various wholesale food price indexes. Each line represents a different type of agricultural commodity. Since wholesale commodity prices tend to rise and fall a great deal more than most consumer prices, the lines representing earnings in terms of food commodities appear much more volatile than the blue line representing overall real earnings. I have tried to include most of the foods that are crucial for U.S. retail purchasers, resulting in the use of 6 of the 8 main BLS commodity indexes that fall under the broad “farm products” category. One can think of the resulting real wages conceptually as the living standards of workers who for some reason use their entire paychecks to buy only one type of farm commodity.

All 6 lines show losses of purchasing power since the start of the time period covered by the graph, reflected in observations at the right side of the figure that lie below zero percent. One example is grain purchasers, who have fared worst among farm-product buyers, according to my chart, suffering a 61.6 percent loss in the grain equivalent of a typical private-sector paycheck since March 2006. Many observers believe that the current commodity price run-up has resulted from an upturn in economic activity that began roughly at the official end of the last recession, while others blame adverse weather trends due to global climate change. Both of these explanations are likely to be of some merit.

Recently, Bank of America research mentioned on the Business Insider website today found that increasing food and energy prices will be high enough this month to wipe out the positive effect on personal income of the payroll-tax withholding reduction that began in January for most U.S. workers. B of A estimates that the tax cut has raised take-home pay by about $8 billion per month, but this year’s food and energy price increases are now costing consumers about the same amount. The macroeconomic effect of this loss of discretionary income could be very important.

Many anti-stimulus economists and politicians have raised the bugaboo that recent upward trends in many commodity prices are the result of “excessive money creation,” a thesis that is effectively challenged by this month’s  San Francisco Fed Economic Letter, which uses a promising methodology to gauge the commodity-price impacts of a number of large-scale Fed securities purchases. (Warning: This is a fairly long and technical article for a noneconomist.) In addition, the S.F. Fed’s website also prominently features this interesting graphic, which shows that commodity price increases are likely to hit the lowest income groups hardest, since, for example, food purchases use up about 40 percent of the lowest income quintile’s pretax income, while household utilities account for roughly 20 percent and gasoline perhaps 10 percent of their income. Considering the enormous numbers of low-income households, it is would be very unfortunate if economists overemphasized the somewhat less relevant fact that food and energy costs now amount to a smaller fraction of total U.S. income than they did during the oil and food price shocks of the 1970s.

Yesterday, corn futures prices at one of the main Chicago commodity exchanges hit a ten-year high. This is a frightening trend indeed.

Comments on next page:
continue reading…

Comments