A Cycle of Financial Fragility?
(click image above to enlarge)
Can a bull market founded largely on credit survive? A forthcoming Levy Institute working paper I wrote with Tai Young-Taft of Bard College at Simon’s Rock (link for those interested) represents an attempt to deal with the role of financial instability—along with other sources of economic fluctuations—in the dynamics of the economy. Here, I’ll focus mostly on the role of margin loans that are used by many investors and traders to leverage positions in stock. The model developed in the paper includes a role for several policy tools that might be used in attempts to stabilize the economy: a fiscal-policy rule with public production and unemployment rate targets, along with public-sector R&D, financial supervision and regulation, and a target for the inflation-adjusted interest rate on government debt.
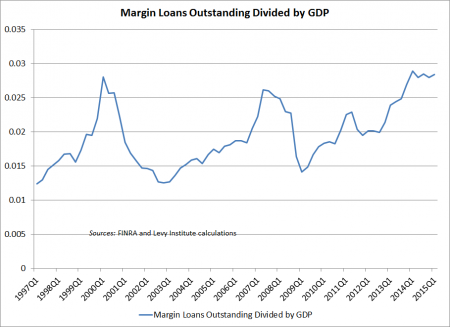
Now, for the current situation. The figure above highlights one potential threat to stability designed to arise spontaneously in runs of the model: surges in the use of margin debt to finance investments in stock. The chart shows that the amount of such debt outstanding in the US relative to GDP rose sharply during the tech bubble and the period leading up to the financial crisis and recession of 2007–09, achieving a new peak each time. Subsequent financial market collapses led to cyclical declines in the use of this form of leverage. On average, for the first quarter of 2015, this ratio stood at more than .028, suggesting that the stock market’s vigor again rests to a great extent on heavy borrowing (see figure). (Moreover, some different but closely related uses of credit, such as bond issues that wind up financing stock buybacks, have also contributed to the post-recession bull market.) This column from the New York Times’s Floyd Norris from a couple of years back discussed evidence that margin-credit cycles helped fuel cyclical movements in stock prices and the economy. His column displayed a longer but now outdated margin loan series.
In the model, margin loans can generate positive feedback effects: a cycle of increasing margin loan balances and rising stock prices, or vice-versa. The story is similar to that of the “levered losses” in housing that took place in a number of countries earlier in this decade (see the recent book House of Debt for one account of the story, although even in this version of the story, I am inclined to see excessive optimism about the usual cure by wage and price adjustments); indeed, big, unsustainable run-ups in asset prices tend to be driven at least in part by credit booms. The situation shown in the figure is only one of many somewhat worrisome signs of market fragility. At the moment, fragility generally seems to be manifested most clearly in big increases in the quantities of various assets and liabilities relative to flow variables such as income and GDP, rather than in yield data.
More on the new paper and the model in it, for those inclined to look into it:
Since this blog has often revisited the theme of MMT (modern monetary theory), I will mention that the new model embodies the assumption—grounded in MMT and chartalist monetary thought—that the public sector (including the central bank) can set the interest rate on its own short-term debt in domestic currency and pay its expenses by crediting the reserve accounts of commercial banks. Hence, the government deficit determines the amount of new government liabilities issued each year, and the portfolio demands of households and banks in turn determine how the accumulated amount is divided between treasury bills and base-money liabilities. The public sector is able to accommodate changes in the preferred holdings of asset-holders by allowing banks to trade treasury bills freely for currency or reserves and vice-versa through open-market operations. This operating procedure enables banks to deal with customer withdrawals and to meet their own reserve requirements—more or less the system used by the Fed and most other central banks in countries with their own currencies and flexible exchange rates.
Also for readers who are fans of MMT (modern monetary theory): Parts of the paper, especially Section 4 and the block of equations to be found there, may also be of interest and help to those seemingly casting about unsuccessfully for a solid mathematical rendering of MMT as part of a model, such as eminent Post-Keynesian theorist Tom Palley, in this uncharacteristically wide-of-the-mark critique (??) (abstract for published version of Palley’s paper). (Note: This post originally provided the wrong link for the published version, substituting a link to the abstract for Palley’s much-sharper rejoinder in the same exchange with MMT advocates Eric Tymoigne and Randy Wray. My apologies.)
The use of a margin loan variable in the new model mentioned above helps us to model destabilizing financial dynamics and their influence on fluctuations in economic growth, unemployment, inflation or deflation, and other macro variables. Other features of the model in the new paper include: bank loans to consumers, a revamped version of a model of financial crises from earlier working papers, including this one, an equation from physics describing atmospheric greenhouse gas accumulation, a model of endogenous technological change, inflation and deflation, and three different types of government activity, including R&D and financial supervision and regulation. On the other hand, one of course should not forget the Levy Institute macro model, as featured in this new US strategic analysis from all of us in the Institute’s US macro team. See Michael’s helpful synopsis.
Technical details on the figure: I have shown a quarterly series which required a few calculations. Since the frequency of the margin loan series is monthly, I have used averaging to obtain quarterly numbers, and then divided each observation by nominal GDP for the quarter. For observations prior to February 2010, I have used the sum of separate figures kept during this period by FINRA and NYSE. The various series can be found on this page on FINRA’s website.
Note: post revised by Greg June 10 for improved readability.


 ShareThis