Archive for the ‘Distribution’ Category

“The Top 10 Percent Get It All”

Michael Stephens | January 30, 2015

Yesterday on the floor of the US Senate, Sen. Bernie Sanders delivered a speech featuring Pavlina Tcherneva’s widely-discussed chart, which illustrates how the bottom 90 percent’s share of income gains during economic expansions has shrunk to (literally) less than nothing. Watch (beginning at 26min50s):

Comments


Looking Beyond the Tax System to Fight Inequality

Michael Stephens | January 22, 2015

In the context of last Tuesday’s State of the Union, Pavlina Tcherneva was interviewed by Wall Street Journal Live‘s Sara Murray on the issue of the effectiveness of policies to combat widening income inequality.


In the interview, Tcherneva comments that while some of the progressive taxation policies outlined by the President may be part of the solution, we ought to be focusing more on raising wages at the bottom and middle of the income distribution through the promotion of tight full employment — with direct job creation policies playing a key role. She notes that the President’s proposal to create more infrastructure jobs would help on that front, but that we are still well short of full employment.*

Tcherneva memorably captured the increasing severity of the problem — economic expansions that have left the bottom 90 percent further and further behind — with the chart below. She lays out a brief summary of her alternative, “bottom-up” approach to fiscal policy in this one-pager: “Growth for Whom?

Tcherneva_Distribution of Income Growth_Levy OP 47

*(Note that Tcherneva’s concept of tight full employment would ultimately bring the unemployment rate below what is conventionally understood as “full employment.” With a maximal job guarantee policy, anyone ready and willing to work would have access to a paid job in the public, nonprofit, or social entrepreneurial sectors.)

Comments


Deflation in the Air

Greg Hannsgen | December 22, 2014

A New York Times article over the weekend delves into the history and rationale of the 2 percent inflation target, beloved of central bankers everywhere and a fairly recent innovation. Of course, the US Federal Reserve has a dual mandate, which includes both inflation and employment goals. The Fed said last week that it was most likely to start raising interest rates around the summer of 2015, but many countries’ central banks are moving in the opposite direction, solely because inflation is falling short of their targets.

Private borrowers—who usually have higher propensities to spend than lenders—benefit from an easing of the burden of debt when wages and prices move broadly upward. Also, for governments with debts that they cannot service with their own currency, inflation eases the burden of making payments, as tax revenues tend to rise in step with nominal wages and prices. Of course, falling prices have the opposite effect. The resulting changes in spending reverberate through the rest of the economy. Recent data show that there exists a strong threat of deflation around the world in economies such as Japan and the Eurozone, where core inflation has recently turned negative.

The effect of deflation on spending by indebted households was noted by Keynes in Chapter 19 of the General Theory (pp. 268-269). Michal Kalecki also argued to this effect in a critique of the so-called Pigou effect (falling prices would supposedly restore full employment by raising the inflation-adjusted wealth of households). The New York Times emphasizes instead the point that lower inflation makes it easier for some inflation-adjusted wages to fall, given that wages do not move downward as easily as upward. It also mentions that modest inflation permits central banks to lower real short-term interest rates below zero. Thoughts that deflation might be coming in much of the world are very sobering.

Comments


Exclusive Growth

Michael Stephens | October 8, 2014

This chart, a version of which Pavlina Tcherneva posted on Twitter, has been getting a lot of attention (e. g., NYTimes, Vox, NPRWaPo, Slate, Moyers & Co.).

Tcherneva_Distribution of Income Growth_Levy OP 47

The chart shows, for each postwar economic recovery in the United States (trough to peak), the share of income growth going to the bottom 90 percent and top 10 percent of the income distribution. And the trend is unmistakable. This is how Tcherneva puts it in a new One-Pager: “For the vast majority of people in the United States, economic growth has become little more than a statistical sideshow.”

This is a picture of an economy that has been broken for some time; well before the cartoonish result in the last partial expansion (during that 2009-12 period, the top 10 percent received 116 percent of the income growth [possible because the bottom 90 percent saw their incomes drop] — and the top 1 percent alone captured 95 percent of the gains).

But Tcherneva also has a particular view of how we can change our policies to help solve this problem. She writes about two ways of improving the income distribution through public policy:

“One is to work within existing structures and reallocate income through various income redistribution schemes after income has been earned. The other is to change the very way income is earned from the outset.”

The way we normally use fiscal and monetary policy to stabilize the economy represents a lost opportunity to affect the income distribution through the second channel, she says. Most conventional policies operate by aiming primarily to boost investment and growth, with the employment effects following as mere byproducts of this process. These conventional stabilization tools (including fiscal pump-priming) don’t do enough to disrupt what she describes as a broken “income-generating mechanism”; one that benefits capital over labor and the incomes of high-wage workers over low-wage workers.

Tcherneva argues that direct job creation policies are different. They can stabilize the economy by targeting the incomes and employment prospects of people at the bottom of the income scale, rather than, for instance, waiting for the effects of improved bank balance sheets to trickle down through the income distribution. By having the government fund employment in the public, nonprofit, and social entrepreneurial sectors for all who are ready and willing to work, her “bottom-up” reorientation of fiscal policy is meant to bring about full employment while raising incomes at the bottom of the distribution faster than those at the top.

As Tcherneva points out, severe income inequality doesn’t just raise concerns about distributive justice, it’s also a serious economic problem: for instance, the Levy Institute’s last strategic analysis argued that inequality has been a significant driver of financial instability in the US economy.

Download the One-Pager: “Growth for Whom?” (pdf)


Related: An older version of this chart appeared in a Levy working paper, and more recently, in an article published in the Journal of Post Keynesian Economics.

Comments


A Recovery for the Top 10%

Michael Stephens | October 7, 2014

Pavlina Tcherneva was interviewed on the Real News Network about what’s behind the numbers in her chart (below) showing the increasingly inequitable distribution of income growth in US economic expansions–and what we can do about it.

Tcherneva_Distribution of Income Growth_Levy OP 47


Related: “Growth for Whom?

Comments


The Implications of Flat or Declining Real Wages for Inequality

Michael Stephens | July 24, 2014

by Julie L. Hotchkiss, a research economist and senior policy adviser at the Atlanta Fed, and Fernando Rios-Avila, a research scholar at the Levy Institute

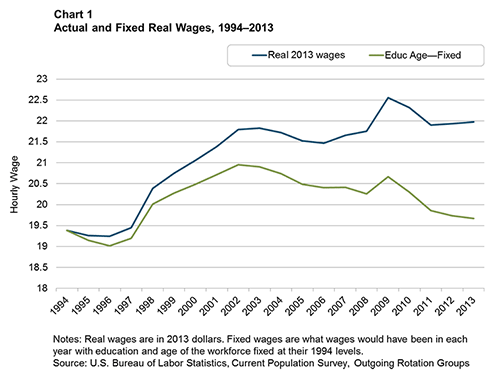
A recent Policy Note published by the Levy Economics Institute of Bard College shows that what we thought had been a decade of essentially flat real wages (since 2002) has actually been a decade of declining real wages. Replicating the second figure in that Policy Note, Chart 1 shows that holding experience (i.e., age) and education fixed at their levels in 1994, real wages per hour are at levels not seen since 1997. In other words, growth in experience and education within the workforce during the past decade has propped up wages.

Chart 1_Actual and Fixed Real Wages

The implication for inequality of this growth in education and experience was only touched on in the Policy Note that Levy published. In this post, we investigate more fully what contribution growth in educational attainment has made to the growth in wage inequality since 1994. continue reading…

Comments


Stiglitz, Galbraith, and Milanovic on Inequality

Michael Stephens | July 3, 2014

From Columbia University’s Heyman Center for the Humanities:

Comments


Inequality, Unsustainable Debt, and the Next Crisis

Michael Stephens | June 18, 2014

In The Guardian, Dimitri Papadimitriou warns that the combined forces of persistent inequality, shrinking government budgets, and the US trade deficit are setting the stage for another private-debt-driven financial crisis:

Right now, America is wrestling a three-headed monster of weak foreign demand, tight government budgets and high income inequality, with every sign that these conditions will continue. With that trio in place, the anticipated growth isn’t going to be propelled by an export bonanza, or by a government investment boom.

It will have to be driven by spending. Even a limping recovery like the one we’re nursing along today depends on domestic demand – consumer spending not just by the wealthy, but by everyone else.

We believe that Americans will keep consuming at the same ever-rising rates of past decades, during good times and bad. But for the vast majority, wages and wealth aren’t going up, so we’re anticipating that the majority of Americans – the 90% – will once again do what was done before: borrow, and then borrow more.

[…]

The more – proportionally – that the top 10% has prospered, saved and invested (naturally, the gains found their way into the financial markets), the more the bottom 90% has borrowed.

Look at the record of how these phenomena have travelled in lockstep. In the first three decades after the second world war, the income of the 90% rose at the same pace as its consumption. But after the mid-1970s, a gap formed – the trend lines on earning and outlays spread apart. Spending continued apace. Real income, meanwhile, stagnated. It was lower in 2012 than it had been forty years earlier. That ever-increasing gap between income and consumption has been filled by borrowing.

Papadimitriou also points out that corporations, which pulled back after the recession, are once again increasing their debt (this began in 2010), and the expectation is for non-financial corporations to add some $4 trillion in debt between now and 2017.

If these debt-fuelled spending dynamics (on the part of corporations and the bottom 90 percent households) don’t come to pass, then we’re looking at a period of low growth and high unemployment–“secular stagnation”–instead.

There are a number of lessons here, but I’d like to highlight two, in case they aren’t obvious. First, even if you aren’t persuaded that income inequality needs to be addressed for reasons of fairness, then financial stability concerns alone should suffice. Second, in the absence of some impending export boom, continuing to reduce the budget deficit at a record pace is the height of recklessness.

Read the Guardian piece for more. The underlying macroeconomic research comes from the Levy Institute’s most recent strategic analysis: “Is Rising Inequality a Hindrance to the US Economic Recovery?

Comments


The Supposed Decade of Flat Wages Was Worse Than We Thought

Michael Stephens | June 12, 2014

It’s well known that the wages of US workers have become disconnected from productivity growth, with real wages growing much more slowly than advances in productivity over the last several decades. This is a key part of the story of widening income inequality.

But these observed trends actually understate the degree to which working people have been left behind. New research reveals that the US economy is doing a worse job passing on productivity gains to workers than the wage growth (or even stagnation) numbers suggest.

The Levy Institute’s Fernando Rios-Avila and the Atlanta Fed’s Julie Hotchkiss looked back to 1994 and tried to see what proportion of real wage growth since then can be accounted for by key changes in the demographic profile of the labor force: principally, the fact that the average worker has become older (i.e., more experienced) and more educated.

What they found is that over 90 percent of real wage growth between 1994 and 2013 was due to demographic shifts. And the 2002–13 period, commonly referred to as the decade of flat wages, is more accurately described as “a decade of declining real wages within age/education worker profiles.” If we control for demographics, wages are back to where they were in 1998. That’s what you’re seeing in the red line below:

Real Wages vs Fixed Real Wages_Levy Institute

Of course, generally speaking, the fact that we have a more educated workforce is good news. But we also want to know the extent to which workers with a particular demographic profile—workers with a given level of experience and/or education—are seeing increases in compensation as labor becomes more and more productive. “When describing the evolution of well-being in the population,” Rios-Avila and Hotchkiss suggest, “an official index for a ‘fixed’ wage trend might be more appropriate for policymakers.” Such an index would paint a disappointing picture of the last decade.

Since 2002, wages have fallen for workers at all levels of educational attainment (this is true whether or not we take ageing into account). And as you can also see in the next figure, when we control for changes in the age/experience profile within each educational grouping, workers without a college diploma are being paid less than they were in 1994 (the gradual erosion of their wages over 2002–08, combined with the recession and unimpressive recovery, have wiped out all the gains these groups at the lower end of the educational scale made from 1994 to 2002).

Fig4B_Wages by Education_Age Fixed

The authors also find that gender and racial wage gaps have shrunk by less than it may appear over the last decade, once we account for demographic changes. Controlling for shifts in the average age and educational attainment within each group allows us to disentangle reductions in pay inequality between male and female workers that are due to, say, women’s educational advancements outpacing men’s, from other sources of progress (or lack thereof) in gender-based wage inequality.

To see the full results, download their new policy note.

Comments


Bubbles and Piketty: An Interview with L. Randall Wray

Michael Stephens | May 29, 2014

L. Randall Wray appeared on Thom Hartmann’s radio show yesterday for a lengthy and wide-ranging interview:

Comments