Call for Papers: Gender and Macroeconomics Conference

Michael Stephens | June 11, 2015

Gender and Macroeconomics: Current State of Research and Future Directions

A conference organized by the Levy Economics Institute of Bard College with the generous support of The William and Flora Hewlett Foundation

BGIA, New York City
108 W. 39 St., Suite 1000A
March 9–11, 2016

Call for Papers

The goal of this conference is to advance the current framework that integrates gender and unpaid work into macroeconomic analysis and enables the development of gender-aware and equitable economic policies. We are especially interested in topics relevant to Sub-Saharan African countries, including but not limited to:

  1. Relationships between economic structure (e.g., the relative importance of the service sector, agriculture, the care economy, trade, etc.), growth regime (wage-led versus investment-led growth), and gender inequities.
  2. Mechanisms and the extent to which unpaid work constrains women’s participation in paid work and access to economic opportunities.
  3. Implications of women’s labor market participation for their well-being and for intrahousehold allocation of time.
  4. Structural, macroeconomic, and microeconomic aspects of women’s employment in the informal sector.
  5. Formulation and analysis of gender-aware policy interventions.
  6. Frameworks for integrating the role of unpaid work in measures of well-being (e.g., time and income poverty).

We invite both theoretical and empirical studies and encourage submissions that employ innovative methodologies and new datasets. We are also interested in papers that provide a comprehensive picture of the state of the art, identify gaps, and indicate directions for future research.

Accommodation and travel-related expenses will be covered by the conference organizers. Please send your abstract via e-mail to Ajit Zacharias ([email protected]).

Important dates:

500-word abstract due July 1, 2015
Acceptance notifications e-mailed September 1, 2015
Final paper due February 1, 2016

Comments


Fed Fiscal Policy, Treasury Monetary Policy

Michael Stephens | June 4, 2015

Don’t miss this post by Scott Fullwiler at New Economic Perspectives.

Fullwiler is reacting to Clive Crook’s Bloomberg column advocating “helicopter drops” (having the Fed simply send checks to households). Helicopter drops or “helicopter money” proposals are widely cast as monetary policy operations (Crook describes helicopter money as a monetary-fiscal “hybrid”) and defended as either preferable to fiscal stimulus or as the only remaining option in light of political obstacles to increasing government spending (to wit, the GOP Congress/Dem White House combination).

For Fullwiler, this way of framing helicopter money is problematic — and relies on a skewed understanding of our policy options:

I find it completely counterproductive to have a theory of macroeconomics in which we define fiscal policy and monetary policy based on who is acting. If the US Congress and Treasury choose to send $1 trillion to households without raising taxes, it’s called fiscal policy. But if the Fed does the exact same thing, it’s apparently called monetary policy. I think this only confuses our understanding of the macroeconomic policy mix and makes it more difficult to have an economics profession that can give good policy advice.

[…]

It seems much clearer to simply say that (a) the act of creating a deficit—raising the net financial wealth of the non-government sector—is fiscal policy, and (b) the act of announcing and then supporting an interest rate target with security sales (or purchases, or interest on reserves)—which has no effect on the net financial wealth of the non-government sector—is monetary policy. In the case of (a), whether the Treasury or the Fed cuts the checks, it’s fiscal policy, and with (b), whether the Treasury or the Fed sells securities, it’s monetary policy.

In other words, fiscal policy is about managing the net financial assets of the non-government sector relative to the state of the economy, and monetary policy is about managing interest rates (and through it, to the best of its abilities, bank lending and deposit creation) relative to the state of the economy. This is in fact how Randy Wray explained both in his 1998 book; it’s also how Warren Mosler explained them in his 1996 paper. That is, from the beginning, MMT has labeled monetary and fiscal policies by their functions, not by who was doing what.

I think this is a much more useful taxonomy because it makes clear from the start that (1) the currency-issuing government isn’t constrained while (2) the interest rate on the national debt is a policy variable. All kinds of human suffering the past 6+ years may have been avoided if those two basic points were widely understood.

Read it.

Fullwiler spoke at the last Minsky conference on issues related to central bank operations (actual, vs. textbook): you can hear his remarks here; slides here.

Comments


A Cycle of Financial Fragility?

Greg Hannsgen | June 3, 2015

Untitled

(click image above to enlarge)

Can a bull market founded largely on credit survive? A forthcoming Levy Institute working paper I wrote with Tai Young-Taft of Bard College at Simon’s Rock (link for those interested) represents an attempt to deal with the role of financial instability—along with other sources of economic fluctuations—in the dynamics of the economy. Here, I’ll focus mostly on the role of margin loans that are used by many investors and traders to leverage positions in stock. The model developed in the paper includes a role for several policy tools that might be used in attempts to stabilize the economy: a fiscal-policy rule with public production and unemployment rate targets, along with public-sector R&D, financial supervision and regulation, and a target for the inflation-adjusted interest rate on government debt.

Now, for the current situation. The figure above highlights one potential threat to stability designed to arise spontaneously in runs of the model: surges in the use of margin debt to finance investments in stock. The chart shows that the amount of such debt outstanding in the US relative to GDP rose sharply during the tech bubble and the period leading up to the financial crisis and recession of 2007–09, achieving a new peak each time. Subsequent financial market collapses led to cyclical declines in the use of this form of leverage. On average, for the first quarter of 2015, this ratio stood at more than .028, suggesting that the stock market’s vigor again rests to a great extent on heavy borrowing (see figure). (Moreover, some different but closely related uses of credit, such as bond issues that wind up financing stock buybacks, have also contributed to the post-recession bull market.) This column from the New York Times’s Floyd Norris from a couple of years back discussed evidence that margin-credit cycles helped fuel cyclical movements in stock prices and the economy. His column displayed a longer but now outdated margin loan series.

In the model, margin loans can generate positive feedback effects: a cycle of increasing margin loan balances and rising stock prices, or vice-versa.  The story is similar to that of the “levered losses” in housing that took place in a number of countries earlier in this decade (see the recent book House of Debt for one account of the story, although even in this version of the story, I am inclined to see excessive optimism about the usual cure by wage and price adjustments); indeed, big, unsustainable run-ups in asset prices tend to be driven at least in part by credit booms. The situation shown in the figure is only one of many somewhat worrisome signs of market fragility. At the moment, fragility generally seems to be manifested most clearly in big increases in the quantities of various assets and liabilities relative to flow variables such as income and GDP, rather than in yield data.

More on the new paper and the model in it, for those inclined to look into it: continue reading…

Comments


Austerity and Growth: Missing the Point

Michael Stephens | May 22, 2015

The pseudo-debate about whether Keynesians and other fellow travellers ought to be embarrassed when governments that engage in fiscal austerity nevertheless experience positive economic growth rates has become a distraction.

For countries like the US and the UK, it is possible under current circumstances for governments to implement budget cuts and still see their economies grow. But the truth of that statement is not fatal to the Keynesian-inspired critique of austerity policies; it is not by any means the end of the story. The more meaningful question is this: What would have to happen in these economies for significant growth to occur in the midst of budget tightening?

Finding an answer to that last question is one of the strengths of the approach to thinking about the economy pioneered by Wynne Godley, and fleshed out further in the Levy Institute’s strategic analysis series. This approach also provides a clear understanding of how deeply irresponsible it is to cut government spending under present economic conditions: because the danger, given the state of the US and UK economies, is not just that budget cuts might slow down the economy, but that they might not.

Let’s look at the United States in particular. In their just-released report, Dimitri Papadimitriou, Greg Hannsgen, Michalis Nikiforos, and Gennaro Zezza point out that, with the exception of a short cycle in the ’70s, “there has been no other recovery in the modern history of the US economy in which government spending decreased in real terms.”
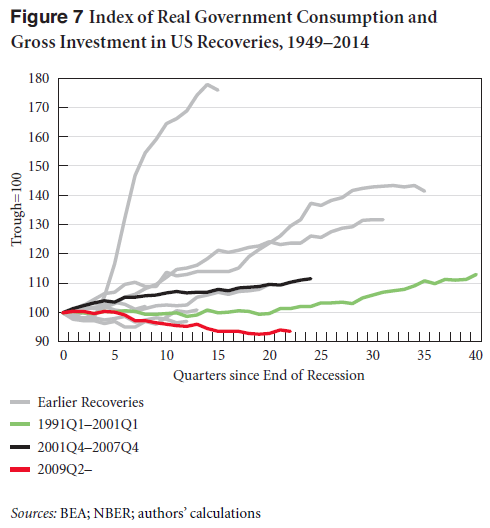
Exceptional Austerity_Levy Institute Strategic Analysis_May 2015

The Congressional Budget Office is predicting that the budget deficit will continue to shrink over the next few years, from 2.8 percent of GDP in 2014 to 2.4 percent in 2018. At the same time, the authors note, the CBO is telling us that GDP will grow at 2.8 percent, 3 percent, 2.7 percent, and 2.1 percent in 2015, ’16, ’17, and ’18, respectively. If we assume that both of those forecasts (for the budget deficit and GDP growth) come true, what would the rest of the economy need to look like?

The United States has run current account deficits, which act as a drag on economic growth, for decades. And despite the recent increase in net exports of petroleum products, which has helped keep the US trade deficit from returning to its sky-high precrisis levels, there is little reason to think that the external deficit will substantially improve over the next few years (if anything, the authors argue, it is likely to get worse. There’s more on recent developments in the foreign sector beginning on p. 6 of the report).

That being the case, GDP growth rates of the sort projected by the CBO can only come to pass on the basis of a rise in private sector spending. In fact, Papadimitriou et al. show that private sector spending would have to expand so much that it would exceed private sector income for the first time since the crisis. In other words, growth would depend on rising private indebtedness.

If the dollar continues to appreciate further and the economies of US trading partners end up performing worse than the IMF expects (a very real possibility, the authors point out, given the optimism of IMF forecasts), this increase in private sector spending over income — and thus the increase in the private debt-to-income ratio — would have to be even larger. Here’s what that would look like (in the chart below, “Scenario 1” corresponds to slower growth among US trading partners [by 1 percent of GDP annually], “Scenario 2” to a 25 percent appreciation of the dollar over the next four years, and “Scenario 3” to a combination of the two):
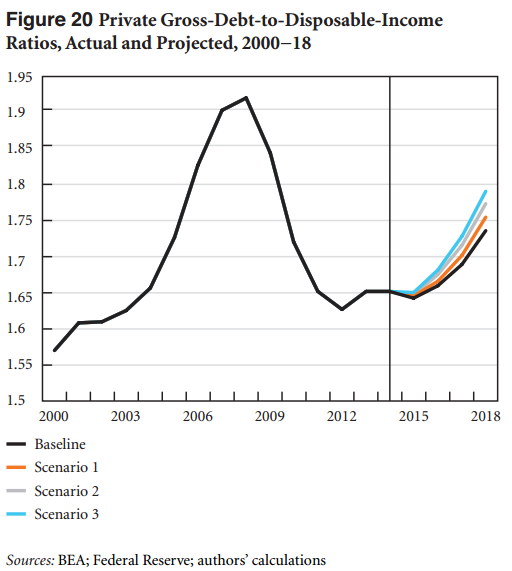
Austerity and Private Debt_Levy Institute Strategic Analysis_May 2015

If private spending doesn’t blow up in this way, the CBO’s optimistic growth projections won’t come about. But if growth does occur, it can only do so (given the external deficit) through a process that raises the debt-to-income ratio of the private sector. As the authors point out, this is precisely the same process that led to the Great Recession and its aftermath.

What’s worse, the state of income inequality in the United States is such that this increase in private debt will be borne disproportionately by households in the bottom 90 percent of the income distribution. Unlike the federal government, which can service its debt through mere keystrokes, US households cannot sustain rising debt ratios of the sort portrayed in the chart above (though the amount of public hand-wringing spent on the debt of the former, as compared to the latter, would suggest the opposite). As Papadimitriou et al. write:

“Increased borrowing of one kind or another can often be sustained for a long time … but eventually, retrenchment takes place relative to incomes. The consequences of any further retrenchment in debt-financed consumer spending would be felt throughout industries that produce for the US consumer, and again, as we noted above, the recovery in real private domestic consumption is already weak relative to any previous recovery.”

To bring this back to the tired discussions surrounding austerity policies: yes, it is possible for the United States to have both tight budgets and rising GDP over the next few years. Fiscal conservatism doesn’t make economic growth impossible in the near term — it makes it impossible to grow without increasing financial fragility. In the absence of a significant increase in net exports, keeping the government budget on its current track will lead to either stagnation or an acute crisis.

Austerians in the United States and elsewhere have been allowed to portray themselves as the champions of steely-eyed realism and prudence. In reality, unless their budget proposals come attached with some workable plan to substantially reduce trade deficits, they are courting private-debt-driven financial crises. In any meaningful sense, they are the true practitioners of fiscal irresponsibility.

Comments


Working Paper Roundup 5/15/2015

Michael Stephens | May 15, 2015

Financing the Capital Development of the Economy: A Keynes-Schumpeter-Minsky Synthesis
Mariana Mazzucato and L. Randall Wray
“Over [the postwar] period, the financial system grew rapidly relative to the nonfinancial sector … To a large degree, this was because finance, instead of financing the capital development of the economy, was financing itself. At the same time, the capital development of the economy suffered perceptibly. If we apply a broad definition—to include technological advances, rising labor productivity, public and private infrastructure, innovations, and the advance of human knowledge—the rate of growth of capacity has slowed. …

The key goal of this paper is to reconsider and discuss the role of finance … that is, how to restructure it to serve the ‘real’ economy, rather than itself, in order to produce both innovation-led growth and full employment. This requires bringing together the thinking of Keynes, Minsky, and Schumpeter, as well as understanding the role of the public sector as doing much more than fixing static market failures.”

Direct Estimates of Food and Eating Production Function Parameters for 2004–12 Using an ATUS/CEX Synthetic Dataset
Tamar KhitarishviliFernando Rios-Avila, and Kijong Kim
“This paper evaluates the presence of heterogeneity, by household type, in the elasticity of substitution between food expenditures and time and in the goods intensity parameter in the household food and eating production functions. We use a synthetic dataset constructed by statistically matching the American Time Use Survey and the Consumer Expenditure Survey. We establish the presence of heterogeneity in the elasticity of substitution and in the intensity parameter. […]

Our results suggest that the effectiveness of economic policies aimed at encouraging healthful cooking and eating habits is likely to vary by household type. Despite this variation, the elasticity of substitution is low for all household types, underscoring the challenges that monetary compensation-based policies may face in effecting a change in food production and eating behavior. Although we apply our dataset to food and the eating production process, the applicability of the dataset extends to the examination of the substitutability in other household production processes.”

On the Determinants of Changes in Wage Inequality in Bolivia
Gustavo Canavire-Bacarreza and Fernando Rios-Avila
“Contrary to the trend in the developed world, Latin American countries have shown a sharp decline in wage inequality during the past decade (2000–12). Bolivia has also experienced this decline, especially in the second part of the past decade. Using the methodology of RIF regression decomposition, we found that after 2006, wages increased across the wage distribution, with the largest changes observable at lower quintiles. … Among other factors, we find that there has been a sharp reduction in returns on higher education at the top of the distribution, as well as increases for returns for low educated workers, which has contributed to the decline of wage inequality. Similarly, wages in occupations with traditionally highly paid jobs have consistently decreased, further contributing to the wage inequality decline. It is possible that the observed changes in inequality are related to increases of the minimum wage, which have multiplicative effects on public-sector wage rates due to salary structures. …

It remains to be seen, however, if these improvements are long lasting, since the reduction in labor income inequality has not been accompanied by improvements in workers’ characteristics (education, experience, and skill). Although improvements in the working conditions (wages) of the most vulnerable populations is an important step toward reducing income inequality, to the extent that these changes are not accompanied by equal gains in workers’ productivity, the reductions in inequality might not be sustainable in the long run.”

Does Keynesian Theory Explain Indian Government Bond Yields?
Tanweer Akram and Anupam Das
“This paper empirically investigates the determinants of changes in Indian government bonds’ nominal yields. Changes in short-term interest rates, after controlling for other crucial variables such as changes in the rates of inflation and economic activity, take a lead role in driving changes in the nominal yields of Indian government bonds. This vindicates Keynes’s theories, and suggests that his views on long-term interest rates are also applicable to emerging markets. Higher fiscal deficits do not appear to raise government bond yields in India.”

Emerging Markets and the International Financial Architecture: A Blueprint for Reform
Jan Kregel
“If emerging markets are to achieve their objective of joining the ranks of industrialized, developed countries, they must use their economic and political influence to support radical change in the international financial system. This working paper recommends John Maynard Keynes’s ‘clearing union’ as a blueprint for reform of the international financial architecture that could address emerging market grievances more effectively than current approaches. […]

From the point of view of the current difficulties facing emerging market economies, the basic advantage of the clearing union schemes is that there is no need for an international reserve currency, no market exchange rates or exchange rate volatility, and no parity to be defended. Notional exchange rates can be adjusted to support development policy, and there is no need to restrict domestic activity to meet foreign claims. Indeed, there is no need for an international lender or bank, since debt balances can be managed within the clearing union. The external adjustment occurs by creating an incentive for export surplus countries to find outlets to spend their credits, which may be in support of developing countries. The system thus supports global demand. Since all payments and debts are expressed in national currency, independence in national policy actions and policy space are preserved. In modern terminology, countries retain monetary sovereignty within the constraint of external balance, which should correspond to full utilization of domestic resources.”

Comments


Elizabeth Warren on Structural vs Technocratic Financial Reform

Michael Stephens | April 16, 2015

From yesterday’s session of the 24th Annual Minsky Conference in Washington, D.C.:

Comments


Not All Macro Models Failed to Predict the Crisis

Michalis Nikiforos |

Noah Smith has a post on the failure of macro theory to predict the crisis. He concedes that DSGE models did very badly on this score, but, he continues, “There are no other models out there that did forecast the crisis” and there is no better alternative.

The word “better” is important here because some “angry heterodox” people have pointed Smith to at least one alternative—Wynne Godley’s Seven Unsustainable Processes—that had in fact predicted the crisis. However, Smith rejects this as “basically just chartblogging” [emphasis added]. He writes that

Yeah, sure, if you put out hand-wavey reports saying “capitalism sux, there’s gonna be a crash!” every year or two, you’re eventually going to be able to say “see, I told you so”. But that’s no replacement for real modeling.[sic]

First of all, there is nothing wrong with chartblogging. In fact, Noah Smith is a chartblogger—an excellent one.

Having said that, is Godley’s argument just hand-wavey-capitalism-sux-chartblogging or is there something more to it (perhaps even some real modeling)?

To begin with, Godley’s argument in the Seven Unsustainable Processes (which is a policy paper) is based on his theoretical work. Godley was one of the major proponents of what is today called Stock-Flow Consistent methodology. Some of his books and his writings (with real models and everything) are here, here, and here.

(The other major proponent of this methodology was James Tobin. His lecture when he was awarded the Sveriges Riksbank Prize in Economic Sciences in Memory of Alfred Nobel was a manifesto of this methodology.)

Based on this theoretical work, in the 1990s Godley built a more policy-oriented macroeconomic model at the Levy Economics Institute. The simulations in the Seven Unsustainable Processes were produced with this model (and are thus far from chartblogging).

To understand the argument of the Seven Unsustainable Processes we need to keep two things in mind. First of all, the analysis is Keynesian, so it is aggregate demand that drives output, employment, and growth. These Keynesian results do not stem from imposing rigidities on an otherwise supply-side neoclassical model.

A second important piece of the analysis is a simple macroeconomic identity that comes straight from the National Accounts:

(Private Expenditure – Income) + (Government Expenditure – Income) = Current Account Deficit

In other words, the sum of the private sector and government sector deficit is always equal to the current account deficit. Accounting consistency requires that the flows expressed in the three balances accumulate into related stocks. For example, if the private sector is running a deficit, that will (ceteris paribus) tend to decrease its net worth and increase its debt and debt-to-income ratio.

The examination of these financial balances in relation to income (or GDP) is important because it gives clues about (i) central structural characteristics of an economy, (ii) which component of demand is driving growth, and finally (iii) what net assets/income ratio for each sector is implied from the current situation.

Having said this, we can now go to the crisis and the question of whether Godley actually predicted it or not. continue reading…

Comments


How Greece Has Been “Helped”

Gennaro Zezza | April 10, 2015

How has the Greek government used international loans?

Using the data available from the flow of funds published by the Bank of Greece and the sectoral accounts published by the Hellenic Statistical Institute (ElStat), we have the following:

Table 1. Greece. Use of international loans (billion euro)
2010 2011 2012 2013 2014* Sum
Sources of funds
1. Long-term loans from abroad 24.3 30.0 110.0 30.8 5.3 200.5
Uses of funds
2. Purchases of securities held abroad 19.9 24.4 44.3 8.0 10.7 107.4
3. Purchases of financial sector equities 0.2 0.9 0.0 19.0 0.0 20.2
4. Capital transfers 3.6 3.7 8.6 23.3 1.4 40.7
5. Interest payments 13.2 15.1 9.7 7.3 5.3 50.6
6. Residual = 1 – (2+3+4+5) -12.7 -14.2 47.3 -26.8 -12.1 -18.4
NB: * First three quarters for 2014

We start by estimating the funds received, using the table on “Financial liabilities broken down by holding sector,” and taking the line “Long-term loans received from abroad.” The largest part of these funds has been used to reduce the existing stock of debt held abroad: line 2 in Table 1 is obtained by the change in government long-term debt securities held abroad, which has been negative from 2010 onwards. A negative change in liabilities amounts to purchasing back the existing stock of debt(1). Another large part has been transferred to the domestic financial sector, either by purchasing equities (line 3 in Table 1, obtained from the data on flows of financial assets purchased by the government and issued by the domestic financial sector) or through capital transfers (line 4 in Table 1, which reports total capital transfers of the government).

If we add the total expenditure of the government on interest payments (line 5), we get that, overall, the international loans have not been sufficient to meet these expenses.

It could be argued that, had the Greek government not recapitalized Greek banks, a major banking crisis would have had even harsher consequences for the population of Greece. On the other hand, since these funds have not reached the Greek population, all debtors (households with mortgages, non-financial firms) who have experienced a severe drop in their income (for households) or sales (for firms) may be unable to meet their financial obligations, and this will imply a new, possibly large, fall in the value of the assets of the Greek financial sector, requiring more government intervention.

The only way to have addressed the Greek public debt problem, which was indeed a problem of foreign debt, in a sustainable way should have been to strengthen the Greek economy in its ability to produce and sell abroad enough to cover for its imports. Greece needed an investment plan; as Joseph Stiglitz just said at the ongoing INET conference in Paris, the “EU addresses the imbalances by making deficit countries starve instead of increasing their exports” (as tweeted by INET).


Notes
(1) In 2010 and 2011 a large negative value in the flow of government securities held abroad was matched, for a total of roughly 20 billion euros, by an increase in the flow held by the Greek financial sector.

Comments


How Do We End the Inequality Feedback Loop?

Michael Stephens | April 7, 2015

“As Hyman Minsky argued, there are many varieties of capitalism, some more stable than others—and, we can add, some more equitable than others.” — Pavlina Tcherneva

Pavlina Tcherneva has revisited her (in)famous inequality chart, which showed an ever-rising majority of the income growth during post-1970s economic expansions being captured by the wealthy (specifically the top 10 percent of income earners). In a recently released policy note, “When a Rising Tide Sinks Most Boats: Trends in US Income Inequality,” she has updated the numbers through 2013 and broken down the top decile further (top 1 percent and 0.01 percent), compared the results of including or excluding capital gains, and looked at what happens to the distribution of income growth when we expand our scope to the entire business cycle (Tcherneva looks at NBER-dated GDP cycles as well as “income cycles” based on real income data from Piketty and Saez).

Here are some of the results:

  • The capital gains discussion yields a somewhat counterintuitive result: when you exclude capital gains, the distribution of income growth between the top 1 percent and bottom 99 percent appears more unequal. Tcherneva explains that this is because even though the bottom 99 percent have barely any capital gains income to speak of (2 percent of their income), their shrinking wage incomes meant that, from 2009-13, these meager capital gains were making the difference between declining (excl. cap gains) and merely stagnating (incl. cap gains) incomes for the bottom 99 percent.
  • When we look at entire economic cycles (peak-to-peak GDP or peak-to-peak income) rather than just the expansion periods, the picture doesn’t look any better. In fact, it’s worse. As Tcherneva notes, although the wealthy tend to lose disproportionately more of their income very early on during downturns, they recover faster and stronger than the bottom 90 percent: “Since the ’70s, when we look at the period beginning only one year after a downturn [and ending at the subsequent peak of the income cycle], the cycle delivers between 78 percent and 107 percent of the income growth to the wealthiest 10 percent of families.” In other words, she writes, “the way we grow recovers the incomes of the top 10 percent first.”
  • She also includes the chart below, which, though not quite as striking at first glance, becomes even more galling as you let it sink in. The chart shows the shares of income growth captured by the bottom 99.99 percent and the top 0.01 percent. By contrast with the other charts (90 percent vs. 10 percent and 99 percent vs. 1 percent), the blue bar is still bigger than the red, but keep in mind we’re talking about a tiny fraction of a fraction of the population in that red bar — around 16,000 families — and as you can see, they gobbled up practically one-third of all the income growth in the last full expansion period (2001-07), with the same worrying trend suggesting itself.

Tcherneva_Levy Institute_When a Rising Tide Sinks Most Boats_Fig3

Tcherneva also comments on the need to reorient our broader policy approach (such that it exists) to combating inequality. One of the points she makes is that we give up too much terrain when we focus disproportionately on raising top marginal income tax rates. continue reading…

Comments


Modern Money, Financial Reform, and the Euro Experiment—an Interview with Randall Wray

Michael Stephens | March 28, 2015

Below is the wide-ranging interview L. Randall Wray gave to EKO – Público TV in Spain as part of the launch of the Spanish edition of his Modern Money Primer (questions in Spanish):

Comments