Archive for the ‘Fiscal Policy’ Category

GDP Revisions and Our Looming Policy Masochism

Michael Stephens | July 29, 2011

The economy grew at an unflattering 1.3% annual rate in the second quarter, while first quarter GDP growth has been revised downwards to a wretched 0.4%.

Against the backdrop of these abysmal numbers, the US government appears poised to do its best to make matters worse.  Even if the debt limit negotiations generate an agreement, this is likely to entail a rather substantial anti-stimulus over the next couple of years.  When combined with the expiration of the unemployment insurance extensions and of last year’s payroll tax cut, one can expect the US government to shortly be withdrawing somewhere on the order of a quarter of a trillion dollars from the economy.

The forecasting group Macroeconomic Advisers estimates that, as a result of the possible debt limit deals alone, GDP will be roughly 0.1 percentage points lower next year, and up to almost 0.5 points lower in 2013.

Again, it is useful to remind ourselves that this is purely self-inflicted.  There is no requirement that budget savings be produced equal to the value of the rise in the debt ceiling—this is entirely a result of political strategy and political demands.  And aside from the debt limit negotiations themselves, there is not much of a case to be made that reducing deficits in the near term in any way solves an emergent economic problem.  Interest rates are low by historical standards and inflation remains in check.  What’s more, key indicators show little evidence of expectations of increasing inflation down the road (for more on this, see the Levy Institute’s Public Policy Brief on the health of the recovery, containing useful numbers on measures of inflationary expectations).

Debt and deficits are not some moral stain on the nation; they are simply a matter of economic accounting.  And as such, with regard to the idea of reducing debt and deficit levels we must always ask:  what problem is this supposed to solve? In a recent working paper, Levy Institute Research Associate Mathew Forstater provides a helpful primer (pp. 6-13) on three different ways of understanding the potential economic issues surrounding government debt and deficits:  from a “deficit hawk,” “deficit dove,” and “functional finance” approach.

MS

Comments


A longer-term Keynesian approach to macro policy

Greg Hannsgen |

Many influential mainstream Keynesian economists continue to support high deficits until the nation’s yawning jobs gap is closed. As Laura D’Andrea Tyson observes in a thorough and helpful blog entry posted this morning, this is not a fine-tuning problem requiring a careful weighing of priorities, given the current state of the job market:

Like many economists, I believe that the immediate crisis facing the United States economy is the jobs deficit, not the budget deficit. The magnitude of the jobs crisis is clearly illustrated by the jobs gap–currently around 12.3 million jobs.

That is how many jobs the economy must add to return to its peak employment level before the 2008–9 recession and to absorb the 125,000 people who enter the labor force each month. At the current pace of recovery, the gap will be not closed until 2020 or later.

In other words, we are not even close to full employment; moreover, as many have observed, inflation appears to be extremely low, with few signs that the stimulus measures taken up to now are bringing about an inflationary takeoff. Hence, it is straightforward to see the urgency of increasing job growth relative to worrying about rising prices, at least for the time being.

Parenthetically, while macroeconomists rightly devote a great deal of attention to these cyclical issues, there are numerous pressing matters other than inflation and unemployment that figure in the recent budget debates in Washington. Many of these issues are at stake in the individual spending cuts and tax-code changes now being debated. Some of the changes being contemplated involve very large amounts of money and programs that are crucial to many people. There is a great danger that these concerns will be lost in the rush to meet an artificial deadline that could after all be eliminated immediately by a single act of legislation, with or without “action” on the deficit.

With a near-consensus in the moderate camp on the need for temporary monetary and fiscal stimulus, I think it might be useful in a policy-oriented forum like this one to point out some of the potential contributions of more encompassing Keynesian approaches and of various post-Keynesian alternatives toward a better set of policies. One of the main issues dividing the mainstream Keynesian approach from these more-radical departures is the importance of the distinction between the short and long runs in deciding the role of macro policy in ending a recession or depression.

Throughout the debate, the moderate Keynesians, who have managed to carry the day many times, have argued that Keynesian stimulus should come before serious belt-tightening designed to reduce the federal debt over the long haul.  The rationale has been that “this too shall pass” in the longer run. But with weakening or mediocre economic data prevailing again recently, the long run appears to once again be the long run. The economy’s power to correct its own course is very much in doubt, but so also are the curative powers of modest stimulus bills in the medium and long runs.

A more helpful role for government might be open, once there was an admission that more-permanent action is needed to solve an unemployment problem that no longer seems to be purely cyclical in nature, but nonetheless to clearly implicate a lack of aggregate demand. Such measures could include longer-term employment opportunities, as well as the creation of new mechanisms designed to automatically stimulate the job market whenever the economy begins to falter. In any case, the thought must be of longer-term policy-planning for adequate stimulus to both supply and demand.

Comments


Will there be a Fed shutdown?

Greg Hannsgen | July 28, 2011

In a recent blog piece at the CNBC website, John Carney offers this interpretation of the federal debt ceiling (see also Felix Salmon’s more recent comment):

“The debt ceiling applies to the face amount of obligations issued under Chapter 31 of Title 31 of the U.S. Code—basically, Treasury notes and bills and the other standard kinds of government debt—and the “face amount of obligations whose principal and interest are guaranteed by the United States Government.” But overdrafts on the Federal Reserve wouldn’t be Treasurys and they aren’t explicitly guaranteed by the U.S. government.

“They’re more like unilateral gifts from the Fed.

“And guess what? The Treasury is allowed to accept gifts that “reduce the public debt.” Since these overdraft gifts from the Fed would allow the government to spend without incurring additional debt, it seems very plausible to argue that this kind of extension of U.S. credit would be permitted under the debt ceiling.”

In normal times, when the federal government has not reached a Congressionally imposed ceiling on its debt issuance, the Fed would indeed honor all checks issued by the U.S. Treasury Department, whether or not Treasury securities had previously been issued in sufficient amounts to “cover” the checks.  Carney may indeed be right that the debt limit law might permit this to continue after the debt limit has been reached on August 2. As pointed out by Carney, the legal issue would seem to turn on the question of whether the “overdrafts” to which he refers would be equivalent to federal debt under the relevant legislation.

In my opinion, this would be good news, as federal debt limits are not helpful to the public interest. I have one additional thought to mention. In Carney’s scenario, it would be likely that banks would begin to accumulate excess reserves at the Fed, where they now earn one-quarter percent interest. Hence, a large portion of the reserves created by the Fed to cover expenditures that would otherwise breach the debt limit would become earning assets for banks, with the Fed paying interest on these liabilities. Legally, of course, reserve deposits at the Fed are liabilities of the Fed and not the federal government.

Also, as Carney points out, banks and recipients of new government checks would seek to purchase existing fixed-income securities with some of the newly created money, probably putting downward pressure on yields. The Fed could then try to keep interest rates from falling by selling securities from its open-market portfolio.

Hence, in Carney’s scenario, the Fed would most likely increase its liabilities and/or decrease its asset holdings by large amounts, a process that would in a sense compensate for the lack of new Treasury-security issuance.  The question is whether this would be legal if the debt limit law was at issue.  If the overdraft strategy turns out to be legal and acceptable to the main players, we could have a far better situation than one in which the federal government could not pay for its normal operations.

Clarification, July 28: It should be duly noted that while August 2 is regarded as the hard-and-fast deadline for raising the debt ceiling, the federal government actually reached its debt limit in May. New debt issuance ceased at that point. The federal government has continued to pay its bills using “extraordinary measures” that were recently outlined by Treasury Secretary Geithner in materials posted here. These measures involve temporarily tapping certain government funds set aside for various purposes. The government has estimated that these alternative ways of funding government expenditures will be exhausted on August 2; hence, this is the date by which the resolution of the current impasse must occur according to the administration. This somewhat technical point was misstated in the post above, which implied that the legal debt limit would not be reached until August 2. We apologize for any confusion this may have caused. -G.H.

Comments


Do we need federal debt at all?

Greg Hannsgen | July 20, 2011


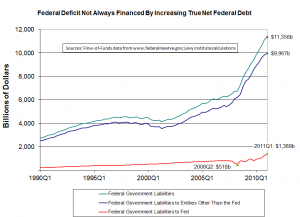
(Click figure to enlarge.)

Could the government loan the money to itself? The federal government is expected reach its debt limit of $14.29 trillion early next month. Normally, the government more or less indirectly sells a large amount of Treasury securities to the Fed, which is technically a private entity, separate from the familiar government run by the President, Congress, and the Supreme Court. This amount has been increasing rapidly, as shown by the red line in the figure above. As the figure suggests, quantitative easing II, or QEII, which officially ended last month, represents only the most recent version of this sort of open-market policy initiative, though it was highly unusual in that it involved very large purchases of Treasury bonds. Hence, even when the government finds that it has to borrow money to pay for its expenditures, it need not borrow from domestic or foreign private investors, or even foreign central banks or the International Monetary Fund (IMF). Instead, it can essentially turn to itself, borrowing from what is close to a government agency, charged with acting in the public interest. Nonetheless, unfortunately, official Treasury Department bond auctions will presumably cease if and when the federal borrowing limit is reached, rendering Fed purchases largely irrelevant to the resolution of Washington’s debt-limit predicament.

Hence, the question arises: if the federal government doesn’t always borrow from the public when it sells bonds, but instead often relies on the Fed, why not dispense with Treasury bond sales altogether and have the Fed simply loan or even transfer funds directly to the federal government whenever tax revenues fall short of expenditures? It would obviously not be simple or easy to switch to such a monetary system, but at least until fairly recent times, most developed countries outside the English-speaking world found it best to provide liquidity for government activities in this way, avoiding the use of open-market operations and making their central banks more literally into instruments of the national governments involved. In such banking-oriented systems, private companies, too, tend to rely heavily on banks rather than financial markets when they need to obtain funds to build new plants, etc. Interest rates are mostly set directly by the banking system rather than in markets. Such financial systems have both advantages and disadvantages, relative to systems like the American one that rely far more heavily on securities and derivatives markets. In many ways, though, the two types of central bank are fundamentally the same, particularly in the way they are relied upon to help pay for government operations.

The issue remains, though, is there anything to be gained by having specific numerical limits on government debt such as the ones imposed by the U.S. Congress? The answer is “no.” Keeping the current limit would only result in a self-imposed disaster.

Update, July 21: Fellow Levy Institute scholar Randy Wray expresses some of the opinions and ideas set forth above in a great blog post that coincidentally appeared on the same day as the one above.  G.H.

Update, July 26: James Surowiecki argues to good effect that debt ceilings should be eliminated in a new article in the New Yorker. -G.H.

Comments


Is Stockman right about deficits, after all?

Greg Hannsgen | April 25, 2011

Many Americans interested in economics will recall David Stockman as the controversial White House budget director who swam against a tide of increasing deficits during Ronald Reagan’s administration in the first half of the 1980s. Ultimately, while Reagan supported many high-profile cuts to social benefits and regulatory budgets, he vastly increased military spending and cut taxes drastically, leading to deficits that disappointed fiscal conservatives. Stockman has an op-ed article in yesterday’s New York Times blasting what he sees as weak efforts by the president and congressional Republicans to come up with long-term plans to cut deficits. He disagrees with the Ryan plan’s focus on cuts to programs that help the poor and Obama’s emphasis on ensuring that the rich pay their fair share.  In Stockman’s mind, these approaches to budget cuts leave the federal government’s main fiscal problems unaddressed but go down well politically.

One should take note that while Stockman’s alarms of more than 25 years ago went largely unheeded, no serious U.S. fiscal crisis materialized, though deficits reached nearly 6 percent of GDP in 1983. On the other hand, unemployment touched double-digit levels early in Reagan’s tenure, making high deficits nearly inevitable and certainly justifiable from a policy perspective. Moreover, numerous other serious problems arose largely as a result of Reagan’s economic policies, including his attack on the “safety net” of social programs for the poor.

Finally, we wish to respond to the fiscal disaster scenario that Stockman presents in today’s article. Levy Institute macroeconomists and other strong proponents of Keynes’s theories have argued in recent years that the United States should run deficits in the amounts necessary to ensure full or nearly-full employment, without fear of bankruptcy or other affordability issues connected with high deficits. We argue that unlike individual U.S. states and members of currency unions, the U.S. federal government can run deficits indefinitely without becoming “insolvent” in any sense or being forced to default.  The government has this ability because the United States uses paper money that is not convertible to a fixed amount of gold or foreign currency.

Reading Stockman’s article, it appears that he might not completely disagree with these views. He observes that the Fed and other central banks have been buying huge amounts of dollars, in essence using their printing presses to provide the real “financing” for large portions of the U.S. deficits. We have noted the success of these routine operations in recent years, observing that interest rates paid by the U.S. government remain extremely low, even as it has borrowed amounts equivalent to approximately 10 percent of yearly national output. Stockman does not miss this fact, but argues that the Chinese central bank will soon reduce its purchases of Treasury securities in order to control domestic inflation, and that the Fed will also be forced to reduce its open market purchases in order to avoid destroying the value of the dollar.  Then, in Stockman’s view, the game that he called into question decades ago will be over.

We certainly concede that the use of a sovereign currency cannot be counted on to overcome fiscal problems unless the issuer of the currency is willing to allow its value to change vis-à-vis other currencies. In the case of the United States at the current juncture, this would hopefully involve substantial real depreciation of the dollar against the Chinese currency, known as the renminbi or yuan. We have advocated such a currency depreciation for some time, though Saturday’s blog entry showed that the U.S. dollar may in fact be undervalued relative to some other important currencies. So we do not imagine that the Federal Reserve and the U.S. Treasury possess any magic powers to defy the laws of budgeting that Stockman himself does not acknowledge in his article.  The main difference between Stockman’s views on this issue and ours appears to be that Stockman opposes further declines in the U.S. exchange rate or believes that current budget plans would result in far more depreciation of the dollar than we anticipate.  From a political standpoint, he believes that the Fed will agree with him on the need to support the value of the dollar, even if such a defense results in greatly increased interest rates. Hence, in Stockman’s view, the Fed will ultimately be forced to accept extremely high interest rates as a result of the high deficits of recent years, making mortgages, business loans, and so on unacceptably expensive to U.S. borrowers. In this sense, as Stockman sees it, the Keynesians will finally be proven wrong.

As of now, we feel that the overall value of the dollar may need to fall further and that while rock-bottom interest rates cannot cure the economy’s main problems, they remain desirable for many reasons. A dollar crisis could conceivably unfold, but such an event would not occur without a confluence of multiple adverse events, with the federal debt constituting only a minor factor. (Some examples of the kinds of events that could somehow precipitate a currency crisis would be a big natural disaster, a crash in another key financial market, or an economic depression.) Hence, the fiscal issues that Stockman sees as crucial should not necessitate cuts to programs like Social Security, Medicaid, or Medicare that otherwise contribute to the nation’s well-being or tax increases on families and others with modest incomes. In holding these views, we disagree with most U.S. “fiscal moderates.” Nonetheless, Stockman’s op-ed piece does a good job of establishing some key points, especially the unfairness of the Ryan plan’s attacks on domestic, discretionary, nondefense spending.

Update, April 29: Click “more” link below to see comments on this post:

continue reading…

Comments


Who has the lowest labor costs?

Greg Hannsgen | April 23, 2011

(Clicking on picture will make it larger.)

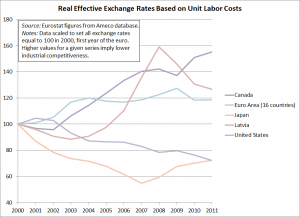
Floyd Norris has an interesting column in this morning’s New York Times. Earlier this week, I was getting ready with some observations similar to his, though I am sure I could not have done as good a job as he has in getting across the gist of the problem and presenting some evidence. Essentially, Norris shows that since the introduction of the euro in 2000, products from the countries now in fiscal crisis have lost competitiveness relative to German products in international markets. Norris presents data on competitiveness. His data is similar to the series depicted in the chart at the top of this post, but the data above are real exchange-rate indexes. The lines in my chart compare the competitiveness of various economies’ exports, taking into account not only differences in unit labor costs but also the values of their currencies relative to those of their trading partners. Norris’s graph and my own feature data from different economies.

Norris’s point is that Germany is an big exporter partly because it has reduced labor costs relative to its competitors. Meanwhile, according to Norris’s theory, the peripheral countries of Europe, such as Greece, Ireland, and Portugal, have become less competitive, as their labor costs have risen relative to those in Germany and other “core” European nations. And because of the common currency, these higher-cost countries cannot use a devaluation to regain competitiveness.

As all acknowledge, the issues involved are complex. One key critique of the current approach to policy embodied by the European Central Bank and European Union rules is that this game clearly has winners and losers, mostly the latter. Norris’s graphs show increasing trade deficits in Italy, France, Spain, as well as the aforementioned troubled economies. While there is no reason that all countries must lead at once, someone, in either government or in industry, must hire workers to produce goods or services if employment is to be increased. Current bailout agreements and big debts are leading to drastic cuts in government employment and wages, even as they bring protests from opposition parties in countries called upon to help fund bailouts. This has contributed to a situation in which unemployment is extremely high in much of Europe, while all are focusing on the need to cut government spending, seemingly ruling out new or enlarged Keynesian public works programs.

However, it must also be said that the notion of cutting wages and benefits is also hard to swallow for most Europeans. The countries currently in deep crisis are not known as having high real wages for rank-and-file workers. Also, wage cuts have a tendency to undermine domestic demand for consumer goods, but cannot accomplish the complex task of making a country’s exports competitive in foreign markets. This is doubly true at a time when so many countries are attempting to cut production costs at the same time. Wage cuts do not reduce standards of living if they are accompanied by cuts in domestic prices. However, deflations have a tendency to make it more difficult for consumers and governments to pay off debts, which are mostly for a fixed amount of euros. Also, most deflationary policies tend to reduce economic growth and are appropriate only when the economy is booming and inflation is high. This is one of the key problems with the “new Keynesian” view—held by many economists—that rigid or “sticky” wages set in union contracts, etc., are a key cause of unemployment during business-cycle downturns.

There is much discussion of these issues on the web these days. Jeffrey Sommers and Michael Hudson, who holds an appointment at the Institute, have pointed out in a number of articles this year (such as this one) that the Latvian economic-policy model, which involved spending cuts and other efforts to regain competitiveness, has not been as popular in Latvia itself as some commentators have implied. Moreover, recent policies in Latvia have led to large-scale emigration, while failing to bring strong economic growth, in the aftermath of a 25 percent fall in output. (Latvia’s real exchange rate is among those shown in the chart above.) Charles Wyplosz analyzes data similar to those shown above and in Norris’s New York Times column and comes to the conclusion that differences in labor costs are fairly small—especially considering the likely accuracy of the data—and are not crucial to current problems in Europe. Last month, Alejandro Foxley of the Carnegie Endowment offered a more sanguine view than Sommers and Hudson of events in Latvia, while attributing many European problems to the rapid deregulation of financial markets and the rush to the adoption of the euro. He sees the latter process as having brought about an unsustainable boom in financial investment, property values, and consumption spending in many currently struggling economies.

We disagree with many of the arguments in these articles. They describe a situation that differs in many ways from the current one here in the United States. But the authors’ analyses are helpful to economists like me who lack intimate knowledge of the countries involved and their economic issues. While European countries should certainly not attempt to reduce wages across the board, policymakers there are in a position in which issues of excessive public debt are very real. Hence, the lessons for the United States, with its dollar-printing machine, are not always straightforward. But also, as the figure above suggests, the United States also has little reason to worry about excessive wages relative to those in the average industrialized country.

Update, April 25, approximately 8:10 am: I have revised the chart to include Canada, a major trading partner of the United States. Also, I made minor clarifying edits to the text used in the post and figure.
Comments


How much food will a week’s earnings buy?

Greg Hannsgen | April 6, 2011

(Click graph to expand.)

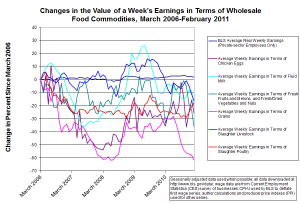
Recent months have seen double-digit increases in energy prices and the prices of many important agricultural commodities. Because of the recent inflation in various raw materials, fuels, and foods, many ordinary Americans have been finding it increasingly difficult to afford basic necessities. The figure above shows just how severe this trend has been. (You will probably need to click on the image to make it larger.)

The lines for various commodity groups begin on the left side of the figure at a level of zero percent for the March 2006 observation. Each subsequent point on a given line shows the total percentage change since March 2006 in the amount of one type of farm product that can be purchased at the wholesale level with the average weekly paycheck. The dark blue line that appears nearly flat shows average real (inflation-adjusted) weekly earnings as reported by the government. The Bureau of Labor Statistics (BLS) uses the consumer price index (CPI-U) to deflate this series. The line shows that the purchasing power of wages for a typical job has increased by only about 2.2 percent over the five-year period shown in the figure. Moreover, ground has been lost since early last fall, when wages were as high as 3.3 percent above March 2006 levels.

The other lines in the figure refer to average nominal weekly earnings deflated by various wholesale food price indexes. Each line represents a different type of agricultural commodity. Since wholesale commodity prices tend to rise and fall a great deal more than most consumer prices, the lines representing earnings in terms of food commodities appear much more volatile than the blue line representing overall real earnings. I have tried to include most of the foods that are crucial for U.S. retail purchasers, resulting in the use of 6 of the 8 main BLS commodity indexes that fall under the broad “farm products” category. One can think of the resulting real wages conceptually as the living standards of workers who for some reason use their entire paychecks to buy only one type of farm commodity.

All 6 lines show losses of purchasing power since the start of the time period covered by the graph, reflected in observations at the right side of the figure that lie below zero percent. One example is grain purchasers, who have fared worst among farm-product buyers, according to my chart, suffering a 61.6 percent loss in the grain equivalent of a typical private-sector paycheck since March 2006. Many observers believe that the current commodity price run-up has resulted from an upturn in economic activity that began roughly at the official end of the last recession, while others blame adverse weather trends due to global climate change. Both of these explanations are likely to be of some merit.

Recently, Bank of America research mentioned on the Business Insider website today found that increasing food and energy prices will be high enough this month to wipe out the positive effect on personal income of the payroll-tax withholding reduction that began in January for most U.S. workers. B of A estimates that the tax cut has raised take-home pay by about $8 billion per month, but this year’s food and energy price increases are now costing consumers about the same amount. The macroeconomic effect of this loss of discretionary income could be very important.

Many anti-stimulus economists and politicians have raised the bugaboo that recent upward trends in many commodity prices are the result of “excessive money creation,” a thesis that is effectively challenged by this month’s  San Francisco Fed Economic Letter, which uses a promising methodology to gauge the commodity-price impacts of a number of large-scale Fed securities purchases. (Warning: This is a fairly long and technical article for a noneconomist.) In addition, the S.F. Fed’s website also prominently features this interesting graphic, which shows that commodity price increases are likely to hit the lowest income groups hardest, since, for example, food purchases use up about 40 percent of the lowest income quintile’s pretax income, while household utilities account for roughly 20 percent and gasoline perhaps 10 percent of their income. Considering the enormous numbers of low-income households, it is would be very unfortunate if economists overemphasized the somewhat less relevant fact that food and energy costs now amount to a smaller fraction of total U.S. income than they did during the oil and food price shocks of the 1970s.

Yesterday, corn futures prices at one of the main Chicago commodity exchanges hit a ten-year high. This is a frightening trend indeed.

Comments on next page:
continue reading…

Comments


Krugman, Galbraith, and others debate MMT

Greg Hannsgen | March 28, 2011

Paul Krugman slugs it out with our colleague Jamie Galbraith and many other “modern monetary theory” partisans at Krugman’s New York Times blog website. Jamie’s most recent retort is at the top of this page of the blog site. Many of the points raised in the discussion there are central to our work here at the Levy Institute and to the views of Galbraith and others in our macro research group.

Update: More links to the ongoing Krugman-MMT debate can be found here.  -G.H., March 31.

Update, August 11: Krugman on MMT again, this time drawing lessons from French fiscal policy between World Wars I and II.

Comments


Some Interesting Charts and Arguments on the Deficit Issue

Greg Hannsgen | March 21, 2011

Some more thoughts on the federal debt, which I blogged about last week: First, at Barry Ritholtz’s blog, there are some other interesting figures: one portraying the gross federal debt in three different ways and another breaking the gross debt down by holder. Ritholtz’s figures use data from the U.S. Treasury Department. Note that the gross debt, which stands at a little over $14 trillion, includes around $3 trillion in securities held by the Social Security and Medicare trust funds. (See Trustees’ report.) These securities are not treated as federal liabilities in flow-of-funds data, the main source for the figures in my earlier post. This difference between net and gross numbers accounts for most of the apparent gap between the figures reported in Ritholtz’s blog and those reported here. Like the Federal Reserve’s portfolio of Treasury securities, the securities owned by the trust funds are essentially both assets and liabilities for the broader federal sector, and for macroeconomic purposes, it is best to net them out in my opinion. This leaves well below $10 trillion in federal debt to the public, according to both flow-of-funds data and the Treasury Department website. Regardless of the exact size of the federal debt, which is not crucial, the point to note right now about the deficit issue is that the economy does not appear to be showing signs of excessive government borrowing. We at the Levy Institute will be writing more about this in the near future.

Along these lines, it was good to see Bill Mitchell’s recent article on the deficit in The Nation. Many of the points raised by Mitchell are crucial to the deficit debate and well expressed in the article.


Comments


Data Show Increased Fed Role in Financing Federal Debt

Greg Hannsgen | March 15, 2011

(Click on graph to enlarge.)

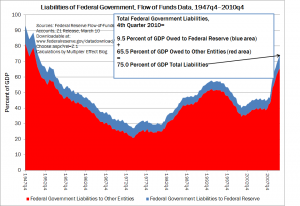
Some interesting information on the federal government’s balance sheet can be gleaned from the fourth-quarter flow-of-funds report, which was released by the Federal Reserve Board on the 10th of this month. The total amount of all federal liabilities, as reported by the Fed last week, is shown as the sum of the red and blue areas in the figure above. The blue portion of the graph represents net liabilities owed by the federal government to the Federal Reserve System, while the red portion shows the rest of the federal government’s liabilities. The blue portion is best netted out of the total debt when one is calculating a figure to be used for policy purposes, as it essentially represents a sum of money that one part of the federal government owes to another. (The Fed describes itself in its educational literature as “independent within the government,” though it is shown in flow-of-funds reports as a separate entity with a separate balance sheet from that of the federal government.)

As noted in the figure above, total federal liabilities, according to the new data, rose in the fourth quarter of 2010 to 75.0 percent of seasonally adjusted U.S. GDP from 72.6 percent the previous quarter. Of this 2.4 percentage-point increase, 1.6 percentage points were accounted for by an increase in net Fed holdings of federal government liabilities, while all other entities increased their combined holdings of these liabilities by only about nine-tenths of a percentage point. Hence, ignoring the more-of-less irrelevant holdings of the Fed, the federal debt stood at approximately 65.5 percent of GDP as of the end of last quarter.

When the Fed purchases federal government liabilities using its open market account, it is swapping money for debt securities, so that economic sectors other than the Fed and the federal government wind up holding more U.S. currency and/or reserve deposits and fewer interest-bearing U.S. liabilities than before. This helps the Fed keep interest rates lower than they otherwise would have been as the total debt rises. Dimitri Papadimitriou and I discuss the increased use of this “financing” strategy in a recent working paper.

A couple of minor technical points: These figures are approximate and do add up in some cases because of rounding. Also, the Fed liabilities data are not seasonally adjusted, though, as noted above, I have divided them by seasonally adjusted GDP figures from the FRED database at the St. Louis Fed website.

Revised to improve clarity by G. Hannsgen on March 17, 2011 at approximately 8:20 am. Specifically, I have clarified the point that the blue portion of the figure, representing federal government liabilities to the Fed, is a net amount. In other words, it shows the amount of federal liabilities to the Federal Reserve System minus the amount of liabilities that the Fed owes to the federal government, all divided by GDP and expressed in percentage terms. Some discussion of this point might have been helpful. To wit: most of the federal government’s liabilities to the Fed are Treasury securities; an example of the opposite variety would be one or another of the several “bank accounts” that the government holds at its central bank. To determine how much the federal government owes the Fed, one must subtract the balance in these bank accounts and the like from the government’s gross liabilities to the Fed. It is only such net amounts that are shown in the blue portion of the figure above. Those figures are in turn subtracted from total federal liabilities as reported in quarterly flow-of-funds data to yield approximations of the quarterly “true” federal debt, which are, of course, depicted by the red area in the picture.

Comments