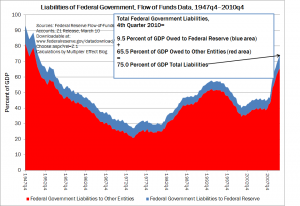
Data Show Increased Fed Role in Financing Federal Debt
(Click on graph to enlarge.)
Some interesting information on the federal government’s balance sheet can be gleaned from the fourth-quarter flow-of-funds report, which was released by the Federal Reserve Board on the 10th of this month. The total amount of all federal liabilities, as reported by the Fed last week, is shown as the sum of the red and blue areas in the figure above. The blue portion of the graph represents net liabilities owed by the federal government to the Federal Reserve System, while the red portion shows the rest of the federal government’s liabilities. The blue portion is best netted out of the total debt when one is calculating a figure to be used for policy purposes, as it essentially represents a sum of money that one part of the federal government owes to another. (The Fed describes itself in its educational literature as “independent within the government,” though it is shown in flow-of-funds reports as a separate entity with a separate balance sheet from that of the federal government.)
As noted in the figure above, total federal liabilities, according to the new data, rose in the fourth quarter of 2010 to 75.0 percent of seasonally adjusted U.S. GDP from 72.6 percent the previous quarter. Of this 2.4 percentage-point increase, 1.6 percentage points were accounted for by an increase in net Fed holdings of federal government liabilities, while all other entities increased their combined holdings of these liabilities by only about nine-tenths of a percentage point. Hence, ignoring the more-of-less irrelevant holdings of the Fed, the federal debt stood at approximately 65.5 percent of GDP as of the end of last quarter.
When the Fed purchases federal government liabilities using its open market account, it is swapping money for debt securities, so that economic sectors other than the Fed and the federal government wind up holding more U.S. currency and/or reserve deposits and fewer interest-bearing U.S. liabilities than before. This helps the Fed keep interest rates lower than they otherwise would have been as the total debt rises. Dimitri Papadimitriou and I discuss the increased use of this “financing” strategy in a recent working paper.
A couple of minor technical points: These figures are approximate and do add up in some cases because of rounding. Also, the Fed liabilities data are not seasonally adjusted, though, as noted above, I have divided them by seasonally adjusted GDP figures from the FRED database at the St. Louis Fed website.
Revised to improve clarity by G. Hannsgen on March 17, 2011 at approximately 8:20 am. Specifically, I have clarified the point that the blue portion of the figure, representing federal government liabilities to the Fed, is a net amount. In other words, it shows the amount of federal liabilities to the Federal Reserve System minus the amount of liabilities that the Fed owes to the federal government, all divided by GDP and expressed in percentage terms. Some discussion of this point might have been helpful. To wit: most of the federal government’s liabilities to the Fed are Treasury securities; an example of the opposite variety would be one or another of the several “bank accounts” that the government holds at its central bank. To determine how much the federal government owes the Fed, one must subtract the balance in these bank accounts and the like from the government’s gross liabilities to the Fed. It is only such net amounts that are shown in the blue portion of the figure above. Those figures are in turn subtracted from total federal liabilities as reported in quarterly flow-of-funds data to yield approximations of the quarterly “true” federal debt, which are, of course, depicted by the red area in the picture.


 ShareThis