Archive for the ‘Distribution’ Category

To Help Address Inequality, Reinvent Fiscal Stimulus

Michael Stephens | March 20, 2012

In 2010, the first year of the economic recovery, 93 percent of all income growth in the US was captured by the top 1 percent, according to Emmanuel Saez.  There are a whole host of reasons for the stubborn persistence of corrosive levels of inequality, but one of the surprising contributing factors may be found in the way we approach fiscal stimulus policy.

In her newest policy note, Pavlina Tcherneva explains how a conventional “prime the pump” approach to stimulating the economy does little to alleviate tendencies toward unequal growth—and may even exacerbate them.  The status quo, at best, offers us two choices in fiscal policy flavors:  austerity and stimulus through aggregate demand management.  While stimulus is preferable, says Tcherneva, there are still flaws in a fiscal strategy that aims at boosting investment and growth without explicitly targeting unemployment.  The problem with pump priming is that it is rarely aggressive enough to adequately reduce unemployment—and when it is sufficiently aggressive, it has inflationary tendencies.

Here Tcherneva is relying on a recent working paper of hers that models the effects of different fiscal policies on prices and income distribution.  She compares the effects of government as a provider of income transfers (in the form of unemployment insurance and investment subsidies), as a purchaser of goods and services, and as a direct employer of workers and finds that the first two policies are more inflationary and more inequitable than direct job creation:  “pro-investment policies in particular add upward pressure to prices and skew the income distribution toward the capital share of income.”

Jumping off from these results, Tcherneva offers a third way on fiscal policy, beyond austerity and pump priming.  continue reading…

Comments


Why Haven’t Business Groups Pushed Harder for Stimulus?

Michael Stephens | March 13, 2012

Although recent employment numbers seem to have set off a fresh round of complacency, the December Strategic Analysis from the Levy Institute makes it pretty clear that more fiscal stimulus is necessary if the economy is going to reach decent levels of growth and employment anytime soon.

However, there’s very little reason to think that anything substantial is forthcoming on the stimulus front, as the US slides slowly into austerity.  And the biggest obstacle is congressional opposition.  Short of an historic wave election, substantial new stimulus just isn’t likely (although when it comes to increasing government spending to counteract a recession, Congress appears to be much more accommodating when there’s a Republican in the Oval Office).  But short of these once-in-generation electoral outcomes, there’s another possibility:  business groups could come around to the realization that they might benefit from an increase in aggregate demand and start seriously pushing their clients in Congress to pass something.

An article in Bloomberg points out that just such a push occurred in the 1940s, as a coalition of business interests, concerned about what would happen to demand as war spending wound down, pushed for fiscal stimulus (interesting side note:  Fed Chairman Marriner Eccles is featured in the article as someone whose Depression-era experience in the private sector led him to conclude that government stimulus was necessary):

Dennison joined forces with Paul Hoffman of Studebaker, advertising executive William Benton, and top managers from Eastman Kodak, General Foods, Sears and General Motors in the Committee for Economic Development in 1942. Fearful that the economy would slip back into a depression once World War II ended, they advocated an activist state that spent money to promote consumption and high employment. Their position was hardly radical, and they aimed their appeal at “all who are interested in keeping the system of private enterprise and larger personal freedom.” But they understood that capitalism could survive only if there was a way to “counter the tendencies toward boom and depression.” Capitalism required growth, by whatever means necessary.

… soon even the Chamber of Commerce took the plunge and joined the growth coalition. Under the dynamic leadership of Eric Johnston, it supported the Full Employment Act of 1946, a Keynesian, albeit conservative, embrace of government spending to reduce the boom-and-bust cycle that Hoffman feared.

It’s notable that such a coalition, as far as I can tell, has not emerged in the contemporary United States.  One can’t help but think that it might have something to do with the decoupling of median and average incomes; with the fact that the top 1 percent seem to be able to enjoy quite robust income growth without needing to pull the average worker along with them.

Comments


A Cycle to Watch Out For

Greg Hannsgen | February 27, 2012

Perhaps we’re back to our old ways. For many moons, the household savings rate has again been falling, though it is still above the levels reached in the years leading up to the home loan crisis of 2007–2009. There are even some signs of a resurgence of the mortgage-backed securities industry. Could the economy be riding a merry-go-round familiar to students of economic history, as concerns about financial fragility, risky borrowing, and small nest eggs ebb and flow with the headlines of the day?

There is an economic term for this type of historical pattern that has not been prominent in recent debates. In loose terms, an epistemic cycle is an economic cycle of learning, knowing about, or understanding certain issues or facts; for example, the dangers of reckless consumer borrowing. The late Hyman Minsky of our Institute wrote authoritatively about the tendency of financial risk-taking to build up over time in the years following a crisis, as people gradually let their guard down after a fight to save the financial system. Eventually such trends would bring on a crisis and a subsequent return to more cautious behavior, especially on the part of banks and regulators.

This leads to the question of whether policymakers can reduce the danger that risky levels and types of borrowing will return over the coming years, as people begin to put the financial turmoil of the past few years into perspective. Economists of all stripes tend to be pessimistic about such issues, ironically in many cases because of a belief that human behavior is generally rational in one way or another.

One concept that often comes up in discussions of policies for dealing with the aftermath of the crisis is moral hazard, which was the subject of an interesting essay in yesterday’s New York Times. continue reading…

Comments


The Sources of Personal Income Since 1947

Greg Hannsgen | February 10, 2012

(Click to enlarge.)

See the blue line in the upper half of the figure above? That line shows the portion of personal income made up of wage and salary disbursements, as a percentage of total personal income.  (As the figure notes, I’ve subtracted social insurance contributions such as Social Security taxes. Also, employer contributions to Social Security, private pensions, etc., have been completely ignored in my calculations.) I have been looking into the possible effects on consumer spending of changes in the composition of income. Please click on figure if you want to see a larger version.

Comments


State Taxes Are Wildly Regressive

Michael Stephens | February 3, 2012

Some indigestible food for thought:  there is not a single state in the Union—not one—in which the top 1% of income earners pay a higher rate of state taxes than the bottom 20%.  For the majority of states, it’s not even close:  the poorest 20% pay somewhere between double and six times the tax rate of the richest 1%.  In Florida, those who make the least pay 13.5% of their income in state taxes, while those who make the most pay 2.1%.

This comes to us from Mother Jones’ Kevin Drum, who dug into the comprehensive “Assets and Opportunity Scorecard” recently produced by the The Corporation for Enterprise Development.

Comments


A Public Option for Banking?

Michael Stephens | November 21, 2011

In the course of an interview by Alan Minsky from a couple of weeks ago, Michael Hudson discussed a proposal for setting up a public option for banking (following the “Chicago Plan” of the 1930s and, says Hudson, Dennis Kucinich’s recent NEED Act):

Instead of relying on Bank of America or Citibank for credit cards, the government would set up a bank and offer credit cards, check clearing and bank transfers at cost. …

Providing a public option would limit the ability of banks to charge monopoly prices for credit cards and loans. It also would not engage in the kind of gambling that has made today’s financial system so unstable and put depositors’ money at risk. …

The guiding idea is to take away the banks’ privilege of creating credit electronically on their computer keyboards. You make banks do what textbooks say they are supposed to do: take deposits and lend them out in a productive way. If there are not enough deposits in the economy, the Treasury can create money on its own computer keyboards and supply it to the banks to lend out. But you would rewrite the banking laws so that normal banks are not able to gamble or play the computerized speculative games they are playing today.

Hudson also argues that distortions in our tax system that encourage debt leveraging are contributing to the fragility of the financial system and worsening inequality:

Over the past few decades the tax system has been warped more and more by bank lobbyists to promote debt financing. Debt is their “product,” after all. As matters now stand, earnings and dividends on equity financing must pay much higher tax rates than cash flow financed with debt. This distortion needs to be reversed. It not only taxes the top 1% at a much lower rate than the bottom 99%, but it also encourages them to make money by lending to the bottom 99%.

Read the whole thing.  An edited transcript of the radio KPFK interview can be found here at NEP (with Hudson adding some post-interview elaboration).

Comments


Taxing the wealthy will not kill jobs

Thomas Masterson | October 21, 2011

I study the distribution of wealth and income here at the Levy Institute, so I read the first five hundred words of Robert Samuelson’s Washington Post column on inequality (“The backlash against the rich,” Oct. 9th) with interest and approval. But I knew it couldn’t last. Once Samuelson gets beyond description and attempts explanation and analysis, he is clearly out of his depth.

Samuelson turns his gaze to the proposal to raise income taxes on those with incomes above a million dollars, whom he refers to as “job creators”—a Republican Party talking point that Samuelson repeats uncritically. He makes two mistakes in citing a paper, written by my colleague Ed Wolff, in which the distribution of assets for the top 1% of households by wealth (total assets minus total debt) is compared to the distribution for the bottom 80%. First, Samuelson seems to assume that those people who own privately held businesses are small business owners. Second, not all of the people in the top 1% of household wealth are households making more than $1 million a year in income.

In Ed Wolff’s paper we see that the wealthiest 1% of U.S. households in 2007 held more than half of their net worth in “unincorporated business equity and other real estate,” and only 26% in financial assets such as stocks, mutual funds, bonds, etc. It is clear that Samuelson is translating the former category as “small and medium-sized companies.” This could be an honest mistake. But it is a mistake. There is no evidence in Ed Wolff’s paper that the top 1% contains all (or no) “small business owners.” Just that they hold twice as much wealth in privately held businesses as in publicly traded businesses.  And as Kevin Drum of Mother Jones put it, “[w]e’re talking about people who earn upwards of a million dollars a year, after all. You don’t get that from taking a minority stake in your brother-in-law’s auto shop.”

If we actually look at those U.S. households receiving $1 million or more in income (using the 2007 Survey of Consumer Finances, as Ed Wolff does), we are talking about 0.37% of households. In terms of the composition of their assets, the picture is pretty much the same for them as for the wealthiest 1% of U.S. households.  But only 24% of the top 1% of household wealth are in the million-dollar income club. If you look at the bottom 99.6% or the bottom 80%, the picture is very different. continue reading…

Comments


Inequality and Crisis

Michael Stephens | October 14, 2011

Nouriel Roubini argues at Project Syndicate that widening inequality lends itself to both economic and political instability.  In his latest policy brief, “Waiting for the Next Crash,” Randall Wray connects some of these same dots, tying the rise of “financialization” and soaring household debt levels to stagnating median incomes in the US:

…as finance metastasized, the “real” economy was withering—with the latter phenomenon feeding into the former. High inequality and stagnant wage growth tends to promote “living beyond one’s means,” as consumers try to keep up with the lifestyles of the rich and famous. Combine this with lax regulation and supervision of banking, and you have a debt-fueled consumption boom. Add a fraud-fueled real estate boom, and you have the fragile financial environment that made the [global financial crisis] possible.

Partly inspired by the work of Hyman Minsky (the Minsky Archives here at the Levy Institute, incidentally, are in the process of being digitized), Wray recommends a set of policy changes that are aimed at righting this imbalance between finance and the “real” economy.  These include restructuring (shrinking) and re-regulating (with strict limits on securitization) the financial sector, and an “employer of last resort” policy that would offer a guaranteed job to everyone willing and able to work (federally funded, with decentralized administration).  The ELR would not just be aimed at addressing the catastrophic unemployment problems associated with a cyclical downturn like the one we’re in now, but at creating a force pushing toward full employment at all phases of the business cycle.  (You can read the brief here.)

Update:  Read the IMF’s recent contribution to the inequality debate here and here.

Comments


How much food will a week’s earnings buy?

Greg Hannsgen | April 6, 2011

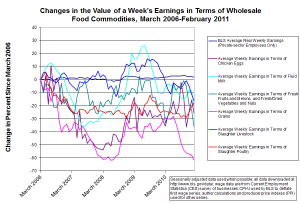
(Click graph to expand.)

Recent months have seen double-digit increases in energy prices and the prices of many important agricultural commodities. Because of the recent inflation in various raw materials, fuels, and foods, many ordinary Americans have been finding it increasingly difficult to afford basic necessities. The figure above shows just how severe this trend has been. (You will probably need to click on the image to make it larger.)

The lines for various commodity groups begin on the left side of the figure at a level of zero percent for the March 2006 observation. Each subsequent point on a given line shows the total percentage change since March 2006 in the amount of one type of farm product that can be purchased at the wholesale level with the average weekly paycheck. The dark blue line that appears nearly flat shows average real (inflation-adjusted) weekly earnings as reported by the government. The Bureau of Labor Statistics (BLS) uses the consumer price index (CPI-U) to deflate this series. The line shows that the purchasing power of wages for a typical job has increased by only about 2.2 percent over the five-year period shown in the figure. Moreover, ground has been lost since early last fall, when wages were as high as 3.3 percent above March 2006 levels.

The other lines in the figure refer to average nominal weekly earnings deflated by various wholesale food price indexes. Each line represents a different type of agricultural commodity. Since wholesale commodity prices tend to rise and fall a great deal more than most consumer prices, the lines representing earnings in terms of food commodities appear much more volatile than the blue line representing overall real earnings. I have tried to include most of the foods that are crucial for U.S. retail purchasers, resulting in the use of 6 of the 8 main BLS commodity indexes that fall under the broad “farm products” category. One can think of the resulting real wages conceptually as the living standards of workers who for some reason use their entire paychecks to buy only one type of farm commodity.

All 6 lines show losses of purchasing power since the start of the time period covered by the graph, reflected in observations at the right side of the figure that lie below zero percent. One example is grain purchasers, who have fared worst among farm-product buyers, according to my chart, suffering a 61.6 percent loss in the grain equivalent of a typical private-sector paycheck since March 2006. Many observers believe that the current commodity price run-up has resulted from an upturn in economic activity that began roughly at the official end of the last recession, while others blame adverse weather trends due to global climate change. Both of these explanations are likely to be of some merit.

Recently, Bank of America research mentioned on the Business Insider website today found that increasing food and energy prices will be high enough this month to wipe out the positive effect on personal income of the payroll-tax withholding reduction that began in January for most U.S. workers. B of A estimates that the tax cut has raised take-home pay by about $8 billion per month, but this year’s food and energy price increases are now costing consumers about the same amount. The macroeconomic effect of this loss of discretionary income could be very important.

Many anti-stimulus economists and politicians have raised the bugaboo that recent upward trends in many commodity prices are the result of “excessive money creation,” a thesis that is effectively challenged by this month’s  San Francisco Fed Economic Letter, which uses a promising methodology to gauge the commodity-price impacts of a number of large-scale Fed securities purchases. (Warning: This is a fairly long and technical article for a noneconomist.) In addition, the S.F. Fed’s website also prominently features this interesting graphic, which shows that commodity price increases are likely to hit the lowest income groups hardest, since, for example, food purchases use up about 40 percent of the lowest income quintile’s pretax income, while household utilities account for roughly 20 percent and gasoline perhaps 10 percent of their income. Considering the enormous numbers of low-income households, it is would be very unfortunate if economists overemphasized the somewhat less relevant fact that food and energy costs now amount to a smaller fraction of total U.S. income than they did during the oil and food price shocks of the 1970s.

Yesterday, corn futures prices at one of the main Chicago commodity exchanges hit a ten-year high. This is a frightening trend indeed.

Comments on next page:
continue reading…

Comments


How many Americas are there?

Greg Hannsgen | April 4, 2011

The new edition of The Atlantic contains this interesting map, showing how changing median incomes and demographics have divided the United States into 12 distinct geographic areas, each contributing to an overall picture of increasing economic inequality. (It may be helpful to use your browser’s “zoom” feature as you look at the map.) For example, our institute is located in a county described by the map as a “monied burb,” while I grew up in a county that the authors have labeled “boom town.” I would venture a guess that many readers who are familiar with these counties will be surprised to see how they are labeled. We take the new map and other efforts like it with a grain of salt, but as something to provoke thought about how things are indeed very different than they used to be.

Comments