Archive for the ‘Employment’ Category

Putting Full Employment Back on the Agenda

Michael Stephens | December 5, 2012

James Galbraith and Randall Wray spoke about returning full employment to the policy agenda at an event in Helsinki on Monday organized by the Foundation for European Progressive Studies and supported by the Kalevi Sorsa Foundation and the Finnish Confederation on Trade Unions (SAK).

Wray focused on Minsky’s under-discussed work on poverty and full employment (the Levy Institute is currently putting together a new book containing a collection of Minsky’s published and unpublished writings on the topic):  “Minsky wrote almost as much on poverty, unemployment, and employment policy as he had on financial instability.”  Video of the presentations is below:

Video of the panel discussion can be seen here.

Comments


Incorrect Economic Historian Is Incorrect

Thomas Masterson | November 20, 2012

Amity Shlaes, whose main claim to fame is an allegedly new history of the Great Depression, thinks we may be in trouble as a result of the election. Looking beyond her alarmingly alliterative title (“2013 Looks to be a Lot Like 1937 in Four Fearsome Ways!”  Oooh! Scary!) she has some valid points. Of course she is talking about the stock market not the real economy, which produces the jobs and the economic benefits most people rely on for a living. And, unfortunately, she doesn’t realize where she is right.

But first, what are the four fearsome factors that will drive us to doom? First, a federal spending spree before the election. Shlaes uses “the old 19% rule” as a benchmark to argue that because federal government spending in 2012 “when the crisis was long past” was 24.3% of GDP, clearly the Obama administration was spending up a storm. To argue that the crisis is long past, one must be willing to ignore the employment crisis that still hasn’t left us, but let’s give her this one. Whether this is a problem given current economic conditions is another story. If it’s the debt implications you’re worried about, it is worth noting that revenues as a percentage of GDP are also quite low historically speaking, just over 15% for the last few years (see CBO’s historical budget data).

Shlaes’ second fear factor is a bath of cold water afterwards. Roosevelt restored budget balance in 1937 and since that very topic (and who David Petraeus was or was not sleeping with) is all people are talking about in Washington these days it seems likely we’ll get spending cuts and tax increases in the next budget. The “depression within the Depression” was the result of exactly this fiscal restraint. This is where Shlaes is quite right, though she doesn’t actually come out and say this: whether the President and Congress jump off the fiscal cliff together, which would reduce spending across the board, or avoid it by cutting spending on everything but defense instead, we are in for poor economic performance indeed.

Shlaes’ third scary thing is the fearsome attack on the status quo. In 1937, this meant raising the top marginal rate from 56% (where it had been raised by Hoover in 1932 from 25%) to 62% (this actually passed in 1936) and the undistributed profits tax. This, and Roosevelt’s attempts to pack the Supreme Court meant that (stock) markets “shivered.” Note that this year, Obama is talking about raising the top rate to, um, 39.6%, which is where it was before the Bush tax cuts. Remember how much markets were “shivering” in the 1990s? Me neither.

continue reading…

Comments


Fiscal Policy Debates and Macro Models Abound in the News

Greg Hannsgen | November 1, 2012

Many of the themes in fiscal policy, economic growth, and distribution that we have been working on here have been in the news lately. Scholars from many fields are weighing in. One common theme is dynamics and their importance:

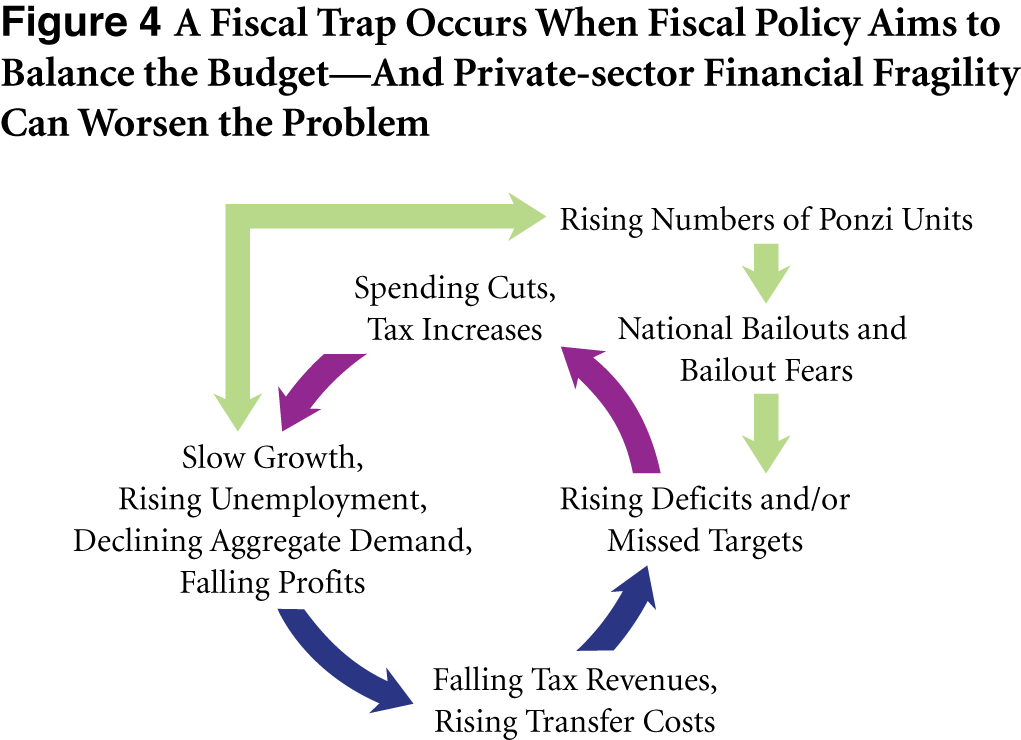
1)      Evidence of a self-reinforcing fiscal trap in operation in Britain, forwarded by the NIESR, a British think tank:  Dawn Holland and Jonathan Portes argue today in Vox that in the UK austerity has led to higher debt-to-GDP ratios, defying the predictions of orthodox macro models. For something from our Institute on the topic of fiscal traps, including the UK example, you might take a look at this public policy brief from Dimitri Papadimtriou and me, posted just last week.

It is important to keep in mind, as the authors of the British study point out, that fiscal austerity is hardly the only cause of the economic crises now underway in much of the world. For example, they get at the problem of coordinating macro policies in a group of open economies. Above this paragraph is a diagram from our brief, illustrating, among other things, the role of Minskyan financial fragility in generating crises in many places in the world. This role is shown by the light green arrows in the diagram, which show how rising numbers of “Ponzi units,” (firms and households that need to borrow in order to make their interest payments) can play a role in a fiscal trap. Spending cuts or tax increases are sometimes “self-defeating” in this view because they undermine the tax base—the amount of activity subject to taxation. The mechanism involved is a Keynesian multiplier effect. Internationally, there are many examples of this problem these days.

2)      More on models of economic growth and income distribution and their relationship to models from applied mathematics in letters to the editor of the Financial Times (here and here) and in a blog post from a mathematician: The FT letters discuss, among other things, the perhaps debatable role of unemployment in keeping real wages from rising. On the other hand, the blog post discusses various kinds of discontinuous dynamic behavior that fall under the rubric of catastrophe theory, mentioning a classic business-cycle model by Nicholas Kaldor and various sorts of straws that break camels’ backs. Author Steven Strogatz notes that “in some…cases (boiling water, optical patterns), the picture from catastrophe theory agrees rigorously with observation. But when applied to economics, sleep, ecology, or sociology, its more like the camel story—a stylized scenario that shouldn’t be taken for more than it is: a speculation, a hint of something deeper, a glimpse into the darkness.”

All of these ideas play a role in numerous macroeconomic models, including the one that I discussed in this post, which features CDF interactive graphics. New macro team hire Michalis Nikiforos has been working on many of these issues, too.

Comments


Unemployment Figures and the Uncertain Future

Greg Hannsgen | October 12, 2012

We expect the unexpected at the Levy Institute. As followers of Keynes, most economists here, including this author, believe that one cannot assign exact probabilities to most important economic outcomes even, say, six months into the future.

On the other hand, thinking about the economic debate on job creation, and the recent release of new jobs data, I have not been very surprised at the gradual pace of progress in reducing the unemployment rate. In fact, we on the macro team have consistently called for more fiscal stimulus rather than less. The reason is that unemployment is a relatively slow-moving variable. As the chart at the top of this post shows, the unemployment rate (shown as a blue line) fell only rather gradually after each of the previous three recessions (shown as shaded areas in the figure). (Here, we count the double-dip recessions of 1980 and 1981–82 as one.) Hence, once the recovery began, we knew that with the unemployment rate at very high levels, it needed to fall unusually fast to be at reasonable levels by this point in the Obama administration.  Hence, since 2007, the team has advocated an easing of fiscal policy. Instead, especially after the 2009 ARRA, little action was taken by the government to stimulate the economy. Partly as a result of inaction on fiscal stimulus, government employment as a percentage of the civilian workforce (red line in the figure above) peters out after 2010.

At this point, we hope for legislation to moderate January’s expected “fiscal cliff”—which will lead to perhaps a $500 billion in reductions in the federal deficit in 2013 unless laws are changed, by CBO estimates.  (In its current form, the cliff would probably have a serious impact on all economic and demographic groups. Lately, I’ve been working on a model that incorporates the larger effects of an additional dollar of income on spending at lower income levels—not a simple task.)

In the figure, both lines are shown in the same units, namely percentages of the civilian labor force age 16 and above, though the two lines use different scales, one on each side of the figure.  For example, a one-unit change in the blue line represents the same number of workers as a move of one unit in the red line. A hypothetical jobs program or another spending measure that gradually increased government employment (red line) by, say, 1 percent of the total US workforce might easily have led to an unemployment rate (blue line) for last month of 1 to 3 percent less than the actual reported amount. But government does not seem to be expanding; in fact, the red line shows that government employment shrank at a time when more hiring from that sector would have been of great help to the economy. (The figures include employees of local and state governments, as well as those of the federal government. The smaller governmental units have seen the biggest cuts in payrolls.) continue reading…

Comments


Why Time Poverty Matters

Michael Stephens | August 20, 2012

(Updated)

by Rania Antonopoulos and Michael Stephens

Poverty is often measured by the ability to gain access to some level of minimum income, based on the premise that such access ensures the fulfillment of basic material needs. But this approach neglects to take into account the necessary (unpaid) household production requirements without which basic needs cannot be fulfilled. In fact, because the two are interdependent, evaluations of living standards ought to consider both dimensions; otherwise, the poverty numbers produced by statistical agencies and used by policy makers are flatly wrong.

Consider, for instance, two identical households of two adults and two children whose annual household incomes are also identical.  In the first household, while the mother or father works and brings in all the income, the other spouse is a stay-at-home parent that raises the children. In the second household, both adults are employed and, as it turns out, they work long hours because their hourly wages are relatively low. Nonetheless, they pull in the same income as the first household (with only one adult working). Income-wise, the two households are identical. What differentiates them is “time”: the first household has an adult with ample amounts of time to devote to cooking, maintenance work, raising the children, etc. The second household does not: it faces a time deficit in that there are not enough hours in the day to work for pay, commute, do the shopping, and then clean, cook, supervise the kids, iron the clothes, etc. This household must either buy the “missing” but essential goods and services or learn to do without. Some households facing time deficits earn sufficient income that allows them to hire a nanny or send the kids to a childcare center; to pay for a domestic worker who can clean the house and prepare home-cooked meals, etc. But others cannot. Simply put, they do not earn enough to afford market substitutes. The second household, as compared to the first one, suffers from material deprivations that are invisible, and hence their poverty, real as it may be, remains hidden from the policy radar.

With the support of the United Nations Development Programme, Ajit Zacharias, Rania Antonopoulos, and Thomas Masterson have developed an analytical and empirical framework that includes unpaid household production work in the very conceptualization and calculations of poverty: the Levy Institute Measure of Time and Income Poverty (LIMTIP). Based on this new analytical framework, empirical estimates of poverty are presented and compared with those calculated according to the official income poverty lines for Argentina, Chile, and Mexico. In addition, an employment-generating poverty-reduction policy is simulated in each country, and the results are assessed using the official and LIMTIP poverty lines.

Clearly, while employment is the key to escaping poverty for some households, for many others, according to our study, it is no answer at all.  Due to low wages, even if time-deficits are not newly created, some households in our study end up joining the working poor. Perversely, for others, as low wages combine with household production time deficits, they end up trading one type of poverty (time) for another (income). Unless supplemented by a living wage policy, regulation or reduction of working hours, and interventions that reduce household production time requirements (childcare, eldercare, after school programs), the newly employed cannot but replicate pre-existing patterns of inequalities and deprivation.

Comments


Some New GDP Numbers–And 3 Trendlines

Greg Hannsgen | July 27, 2012

We end the week with news of only modest economic growth, but also with a set of revised data that does not seriously worsen the economic outlook. Today the Bureau of Economic Analysis announced the release of an advanced estimate of 2nd quarter GDP, as well as revised data for 2009Q1 through 2012Q1. Their press release notes that:

“Real gross domestic product—the output of goods and services produced by labor and property located in the United States—increased at an annual rate of 1.5 percent in the second quarter of 2012, (that is, from the first quarter to the second quarter), according to the “advance” estimate released by the Bureau of Economic Analysis. In the first quarter, real GDP increased 2.0 percent.”

An article from the FT  points out that consumption grew by 1.5 percent, while government spending at all levels of government fell by 1.4 percent. Leaving the drop in government spending out of the calculation would raise the overall growth rate to 1.8 percent per year, or .3 percent higher than the actual figure released today.

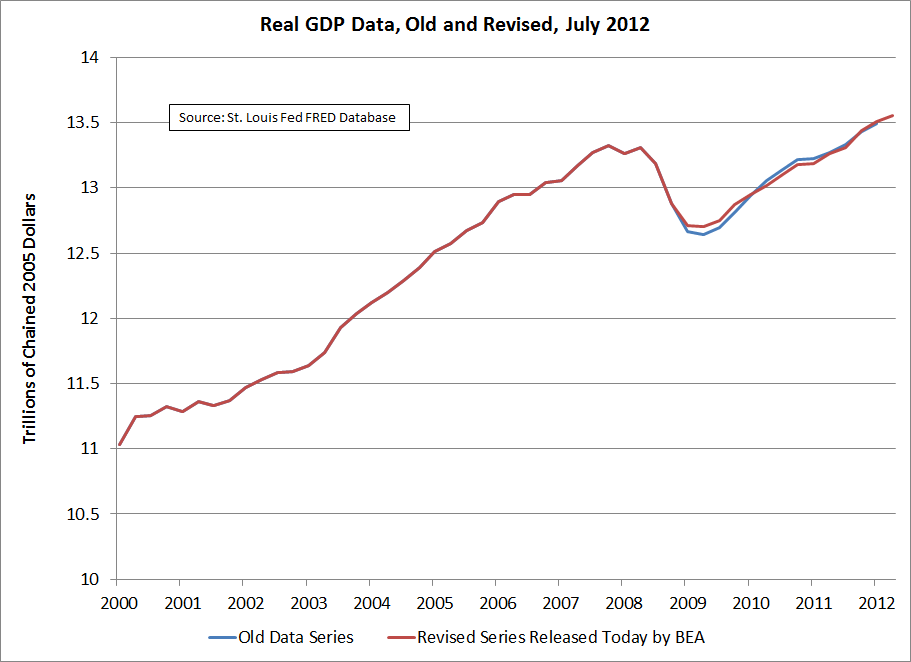
Here is a graphical comparison of the old and new data series:

As the figure shows, the new data series implies that the fall in real GDP during the 2007–09 recession was not as deep as previously believed, though this difference is rather small. (Note: This earlier FT article mentions some of the reasons the GDP series needs to be revised, and well as some of the anticipated policy implications of today’s data release.)

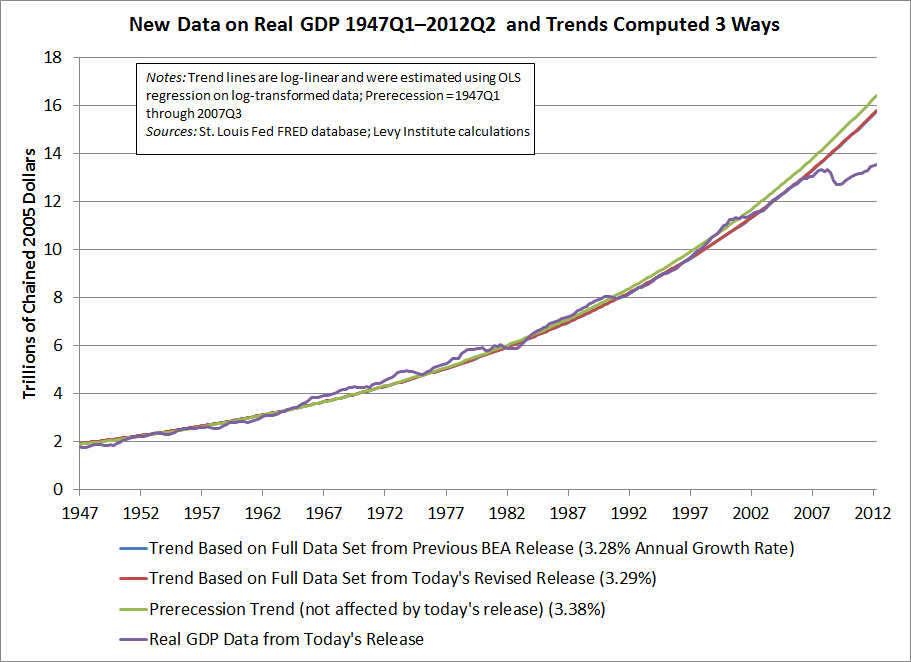
Also, the revisions make only a slight difference in an estimated trend line for all the data, as seen in the figure below, where the blue line is hidden behind the red one. However, these trend lines are much different from a similar estimate constructed using prerecession data (1947Q1–2007Q3) only, which is also seen below.

The continuing weakness of the actual GDP data compared to the prerecession trend line provides further support to the notion that the economy has a lot of extra room to grow. In other words, such a sharp drop in economic activity relative to an existing trend is an indication that private-sector output can recover to a great extent without straining supplies of labor and most other resources. Hence, economic stimulus designed to increase aggregate demand is in order, as we have argued for some time. The reported decline in government spending is of some concern indeed.

These numbers of course do not constitute a good measure of national well-being, but at their recent levels, they are symptomatic of an economy experiencing a prolonged period of high unemployment rates, which can contribute to many other social and economic problems.

Postscript, July 27: Interesting, same-day posts by New York Times bloggers  point out that the revised data reveal a shrinking government sector and analyze the effects of the revisions.

Comments


Beyond “Fixing” the “Fiscal Cliff”

Greg Hannsgen | July 26, 2012

The cliff approaches, and politicians and pundits in Washington are pondering how to deal with it. For those who have forgotten, recent nontechnical summaries of the legislative issues and amounts of money at stake can be found here , here, and in this old post. But essentially, the term “fiscal cliff” refers to a massive group of tax increases and spending cuts due to take effect on or around January 1 of next year. President Obama and some Congressional Democrats are seeking to take a stand for distributional fairness and deficit reduction at the same time by pushing for a renewal of the Bush tax cuts, but only for those with incomes less than perhaps $250,000 for a couple. On the other hand, some long-time fiscal conservatives are seeking to cushion the blow by delaying the impact of the spending cuts and tax increases and by seeking a less indiscriminate choice of program cuts. They emphasize that in any case, draconian measures must in their view be taken eventually and committed to now.

From the point of view of Keynesian macroeconomics, what the fiscal conservatives fail to understand is that the economy requires even more fiscal ease than they have been willing to contemplate so far; otherwise, like Spain and many other European nations (see the FT and the WSJ on the European austerity debate), this country will experience such weak economic performance that even the goal of reducing the deficit will be elusive—let alone feeding the hungry, keeping states and localities from going broke, maintaining an adequate defense, or funding scientific research.

The automatic spending cuts (known also as sequesters) due to take effect soon are designed to hit almost every discretionary defense and nondefense spending item—to the tune of 10- to 15-percent cuts in what the federal government spends each day on average on these items. continue reading…

Comments


More on Austerity: Fiscal Threats to the Food Safety Net

Greg Hannsgen | July 10, 2012

As the Center on Budget and Policy Priorities (CBPP) has reported in several recent postings, cuts to SNAP—formerly known as the food stamp program—now being considered in Washington would impose severe hardship on millions of people who use SNAP benefits to buy groceries in retail stores. For example, the Center released a report a few days ago on cuts to the program contained in the farm bill recently proposed by House Agriculture Committee leaders. These three points, quoted from the report, summarize the impact of the proposed cuts:

  • The bill would terminate SNAP eligibility to several million people.  By eliminating categorical eligibility, which over 40 states have adopted, the bill would cut 2 to 3 million low-income people off food assistance.
  • Several hundred thousand low-income children would lose access to free school meals.  According to the Congressional Budget Office (CBO), 280,000 children in low-income families whose eligibility for free school meals is tied to their receipt of SNAP would lose free meals when their families lost SNAP benefits.
  • Some working families would lose access to SNAP because they own a modest car, which they often need to commute to their jobs.  Eliminating categorical eligibility would cause some low-income working households to lose benefits simply because of the value of a modest car they own.  These families would be forced to choose between owning a reliable car and receiving food assistance to help feed their families.

(The Ryan budget would lead to even larger cuts, as this report shows.) As a macroeconomist, I tend to be in favor of government programs that automatically increase in size as the economy falls into a recession. Of course, such programs help to maintain spending when households and/or businesses suffer a setback due to a financial crisis or some other macroeconomic problem. Many of these programs have the added advantage that they focus on the most adversely affected individuals. They are aimed at providing people with the most basic essentials. They reduce the need for ad hoc “stimulus bills” during recessions. Finally, they are known for achieving an especially high level of “bang for the buck,” as a form of fiscal stimulus, because they go mostly to individuals who spend almost all of their small-to-modest incomes. (An employer-of-last-resort program would represent perhaps the “alpha and omega” of such automatic-stabilizer programs.)

The proposed cuts would fall on a program that has grown rapidly in recent years. continue reading…

Comments


Defense Department Minskyites

Michael Stephens | July 2, 2012

A few months ago we wondered why it was that business groups hadn’t been pushing harder for more stimulus.  My proposed (unoriginal) explanation had to do with inequality and decoupling; Paul Krugman suggested social pressures might also play a part.  But as it turns out, there’s another answer:  they are pushing!  The National Association of Manufacturers (NAM) recently endorsed expanding a government program with the intent to directly and indirectly create one million jobs.

Bruce Bartlett (former Treasury Secretary in the Reagan administration) highlights the fact that the influential NAM has released a report detailing how the defense spending cuts scheduled for 2013 as a result of the Budget Control Act (the debt ceiling deal from last summer) will harm employment and growth.  So technically this isn’t really an example of pushing for more stimulus; we’re just talking about preserving levels of funding and preserving jobs.  But the logic of the NAM position goes a long way.

For instance, they argue that the knock-on effects of restoring the public spending cuts would create a substantial net number of jobs in the private sector.  In other words, they have implicitly abandoned the argument that increasing government spending or public job creation (above scheduled 2013 levels) would “crowd out” private spending and job creation, embracing instead some version of a multiplier effect.  And if you follow the NAM that far, what reason is there to assume that we’re currently sitting (which is to say, before the Budget Control Act cuts take effect) right at some optimal level of spending and employment beyond which a direct job creation program would no longer be effective?

And if increasing defense production is deemed a worthy investment of public resources, why not early childhood education or environmental renewal?  Mathew Forstater presented at the Levy Institute’s Minsky Summer Seminar on the concept of an employer-of-last-resort (ELR) program that would fund community organizations to hire anyone willing and able to work at a “green job.”  The program would address our current unemployment crisis and, because it’s designed to operate at all phases of the business cycle, the failure to reach full employment, all while helping tackle environmental challenges.  (A recent working paper by Antoine Godin does some modeling of the likely effects of a green jobs ELR.) continue reading…

Comments


Some Views on the “Cliff”

Greg Hannsgen | June 15, 2012

On the topic of public policy, this Works Progress Administration (WPA) poster from the 1930s seems particularly relevant this year. You may have heard of the “fiscal cliff” that the federal budget will fall off in January, under existing law. It will be quite a fiscal contraction, if it happens as scheduled: about 4 percent of last year’s GDP, to use these numbers from the Congressional Budget Office (CBO). This total includes both tax increases and spending cuts, but not the offsetting effects of “automatic stabilizers,” such as lower income taxes for people whose incomes are adversely affected by the cliff itself. The CBO report projects that this set of changes would lead to a recession early next year. (Briefly, the changes that make up the cliff are (1) the expiration of the “Bush tax cuts,” the 2 percent payroll-tax holiday, and some other tax cuts; (2) the across-the-board spending cuts broadly agreed to by President Obama and Congress as part of last summer’s deal to raise the debt limit; (3) the end of new emergency extended unemployment benefits; (4) reduced Medicare doctor payment rates; and (5) tax increases included in the “Obamacare” health act passed by Congress in 2010.)

I chose the image at the top of this post out of many available free-of-charge at the Library of Congress’s WPA-poster archive mostly because of its cliff theme (this poster happens to depict a place in the state of New York, perhaps a few hours’ drive from the Institute). But we also hope the image will offer readers some hope—as the WPA did for unemployed artists and others during the 1930s. The White House and many in Congress are working on legislation that may lessen the severity of next year’s fiscal crunch. These important proposals will mostly aim to delay or cancel scheduled changes to spending programs and the tax code. To really tackle the unemployment problem, however, Washington ought to consider a large-scale public-employment program a bit like the WPA. As the website for our employment policy and labor markets research program points out, “Levy Institute scholars have proposed a full-employment, or job opportunity, program that would employ all who are willing to work and increase flexibility between economic sectors…”  You might want to take a look at some of the many publications at that website that deal with the potential design and impact of full-employment, direct job creation programs.

Comments