Archive for the ‘Distribution’ Category

A New Collection of Minsky’s Work

Michael Stephens | April 8, 2013

Hyman Minsky is probably best known for his work on financial instability and financial reform, but he also wrote extensively about how to address the persistent problem of all those left behind by our increasingly financialized economy; about how to design policies that would put an end to income poverty in the midst of plenty. Despite the fact that far more attention has been paid to his writing on financial fragility, these were intimately related issues in Minsky’s research, connecting the financial and “real” economies.

As with his work on finance, Minsky’s approach to poverty did not fit comfortably within the confines of the status quo. With “trickle-down” on one side, pure tax-and-transfer approaches on the other, and vague calls for retraining floating somewhere in the middle, Minsky found the conventional menu of policy options incomplete and inadequate (a menu that has changed very little over the last several decades). Calling for “upgrading” workers without ensuring there are enough jobs to go around is, as Minsky put it, “analogous to the great error-producing sin of infielders — throwing the ball before you have it.” What’s missing, he thought, is a commitment to ensuring that paying jobs are available to all who are ready and able to work; a commitment to “tight full employment.” The question is how to get there without sparking runaway inflation or inducing financial crises. Private markets, left to their own devices, aren’t going to get us there. For part of the answer, Minsky turned to a forgotten side of the New Deal:  direct job creation.

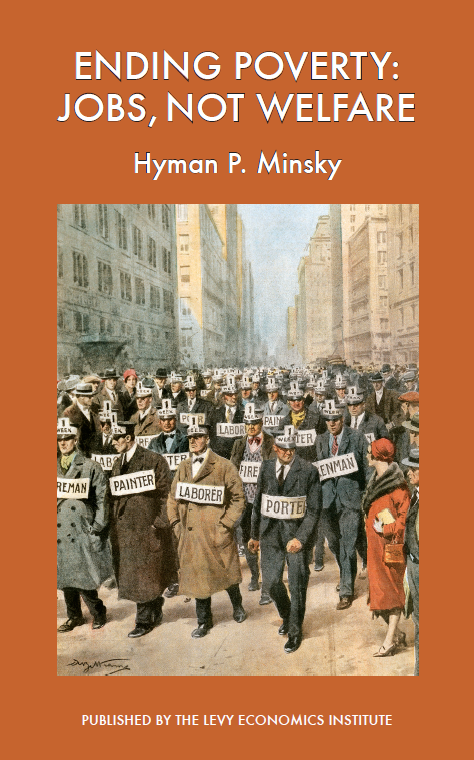
In the interests of providing a more complete picture of Minsky’s intellectual legacy, the Levy Institute has published a collection of his central writings on poverty and full employment: Ending Poverty: Jobs, Not Welfare. The chapters span roughly three decades of Minsky’s writing and feature four never-before-published pieces. The earliest were written in the context of the “War on Poverty” of the Kennedy and Johnson years, but readers will find more than mere historical interest here. Minsky’s critiques of both the “neoclassical synthesis” and the welfare state hold up rather well. If anything, the material is even more relevant today, given our widening income inequality and chronic rates of long-term unemployment — and the fact that the battle against poverty, while not won, has largely been forgotten.

The paperback is now available on Amazon; the Kindle version will be appearing shortly.
Ending Poverty_cover

Comments


Fiscal Policy Debates and Macro Models Abound in the News

Greg Hannsgen | November 1, 2012

Many of the themes in fiscal policy, economic growth, and distribution that we have been working on here have been in the news lately. Scholars from many fields are weighing in. One common theme is dynamics and their importance:

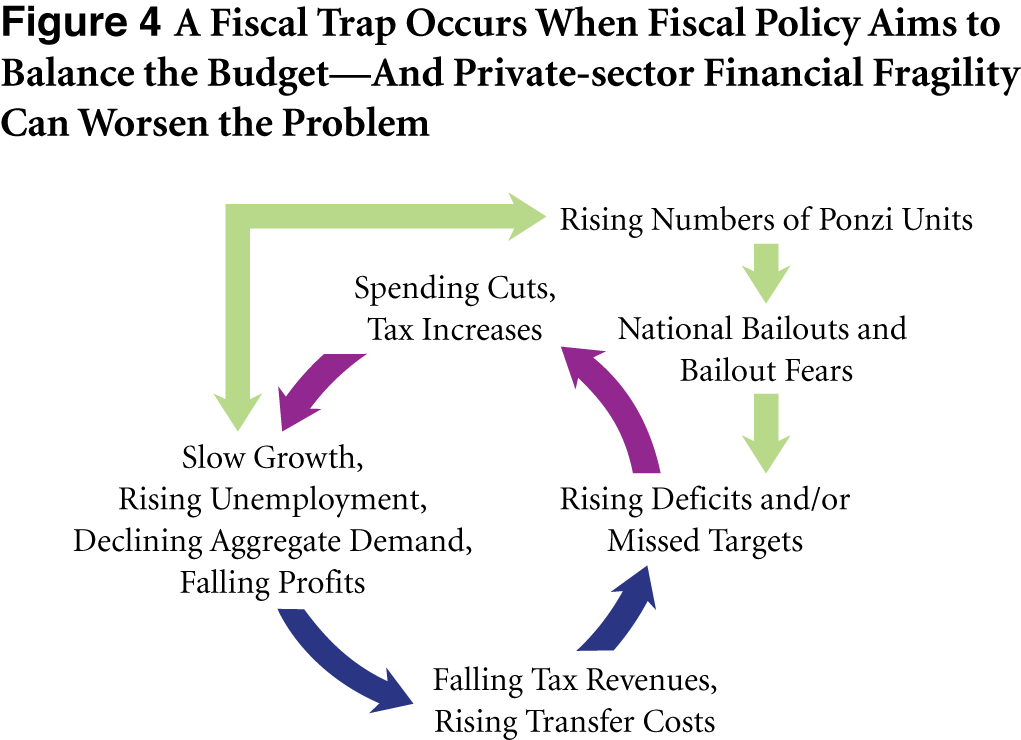
1)      Evidence of a self-reinforcing fiscal trap in operation in Britain, forwarded by the NIESR, a British think tank:  Dawn Holland and Jonathan Portes argue today in Vox that in the UK austerity has led to higher debt-to-GDP ratios, defying the predictions of orthodox macro models. For something from our Institute on the topic of fiscal traps, including the UK example, you might take a look at this public policy brief from Dimitri Papadimtriou and me, posted just last week.

It is important to keep in mind, as the authors of the British study point out, that fiscal austerity is hardly the only cause of the economic crises now underway in much of the world. For example, they get at the problem of coordinating macro policies in a group of open economies. Above this paragraph is a diagram from our brief, illustrating, among other things, the role of Minskyan financial fragility in generating crises in many places in the world. This role is shown by the light green arrows in the diagram, which show how rising numbers of “Ponzi units,” (firms and households that need to borrow in order to make their interest payments) can play a role in a fiscal trap. Spending cuts or tax increases are sometimes “self-defeating” in this view because they undermine the tax base—the amount of activity subject to taxation. The mechanism involved is a Keynesian multiplier effect. Internationally, there are many examples of this problem these days.

2)      More on models of economic growth and income distribution and their relationship to models from applied mathematics in letters to the editor of the Financial Times (here and here) and in a blog post from a mathematician: The FT letters discuss, among other things, the perhaps debatable role of unemployment in keeping real wages from rising. On the other hand, the blog post discusses various kinds of discontinuous dynamic behavior that fall under the rubric of catastrophe theory, mentioning a classic business-cycle model by Nicholas Kaldor and various sorts of straws that break camels’ backs. Author Steven Strogatz notes that “in some…cases (boiling water, optical patterns), the picture from catastrophe theory agrees rigorously with observation. But when applied to economics, sleep, ecology, or sociology, its more like the camel story—a stylized scenario that shouldn’t be taken for more than it is: a speculation, a hint of something deeper, a glimpse into the darkness.”

All of these ideas play a role in numerous macroeconomic models, including the one that I discussed in this post, which features CDF interactive graphics. New macro team hire Michalis Nikiforos has been working on many of these issues, too.

Comments


Unemployment Figures and the Uncertain Future

Greg Hannsgen | October 12, 2012

We expect the unexpected at the Levy Institute. As followers of Keynes, most economists here, including this author, believe that one cannot assign exact probabilities to most important economic outcomes even, say, six months into the future.

On the other hand, thinking about the economic debate on job creation, and the recent release of new jobs data, I have not been very surprised at the gradual pace of progress in reducing the unemployment rate. In fact, we on the macro team have consistently called for more fiscal stimulus rather than less. The reason is that unemployment is a relatively slow-moving variable. As the chart at the top of this post shows, the unemployment rate (shown as a blue line) fell only rather gradually after each of the previous three recessions (shown as shaded areas in the figure). (Here, we count the double-dip recessions of 1980 and 1981–82 as one.) Hence, once the recovery began, we knew that with the unemployment rate at very high levels, it needed to fall unusually fast to be at reasonable levels by this point in the Obama administration.  Hence, since 2007, the team has advocated an easing of fiscal policy. Instead, especially after the 2009 ARRA, little action was taken by the government to stimulate the economy. Partly as a result of inaction on fiscal stimulus, government employment as a percentage of the civilian workforce (red line in the figure above) peters out after 2010.

At this point, we hope for legislation to moderate January’s expected “fiscal cliff”—which will lead to perhaps a $500 billion in reductions in the federal deficit in 2013 unless laws are changed, by CBO estimates.  (In its current form, the cliff would probably have a serious impact on all economic and demographic groups. Lately, I’ve been working on a model that incorporates the larger effects of an additional dollar of income on spending at lower income levels—not a simple task.)

In the figure, both lines are shown in the same units, namely percentages of the civilian labor force age 16 and above, though the two lines use different scales, one on each side of the figure.  For example, a one-unit change in the blue line represents the same number of workers as a move of one unit in the red line. A hypothetical jobs program or another spending measure that gradually increased government employment (red line) by, say, 1 percent of the total US workforce might easily have led to an unemployment rate (blue line) for last month of 1 to 3 percent less than the actual reported amount. But government does not seem to be expanding; in fact, the red line shows that government employment shrank at a time when more hiring from that sector would have been of great help to the economy. (The figures include employees of local and state governments, as well as those of the federal government. The smaller governmental units have seen the biggest cuts in payrolls.) continue reading…

Comments


What Are the Post Keynesians Up To?

Greg Hannsgen | October 2, 2012

I returned to the Levy Institute yesterday after the International Post Keynesian Conference in beautiful Kansas City. I will mention some of the news from the conference, for readers who are interested in the kinds of events that Levy Institute scholars attend.

At such conferences, ideas are taken very seriously, and many interesting debates were simmering at this one.  Theories and models abounded. Many of them went right to the heart of the causes of the financial crisis.

Speaking of interesting, students were among those attending and helped to organize the conference. Some were selling official conference t-shirts as well as used books in the vendors’ area. I haven’t had a chance to try my shirt on, having returned home only Sunday night on a delayed flight.

Many of the giants in the field were there.  A surprise event in honor of the Institute’s Jan Kregel took place last Thursday night, the first night of the conference.  Kregel recently joined Paul Davidson as an editor of the Journal of Post Keynesian Economics. A new Post Keynesian economic policy forum is online, and many from the Institute are editors. This new paperback from Eckhard Hein and Englebert Stockhammer, also on display at the conference, explains some of the ideas and history of this school of economists, including their conferences. Post Keynesian and Keynesian economics have of course been resurgent in recent years, and the topic of Hyman Minsky (whose archive is here) in particular frequently came up in the presentations and discussions among the economists.

An enjoyable keynote speech by noted author Robert Skidelsky came after the conference was officially adjourned. Skidelsky argued in favor of an “underconsumptionist” interpretation of the current world economic situation. In other words, a tilt in income distribution reduces spending by the masses. He noted that Keynes himself deployed such an argument in his later work, though his 1936 General Theory of Employment, Interest and Money emphasized that volatile investment, driven by changing expectations, largely accounted for fluctuations in total output and employment.  The speech also mentioned the views of Depression-era Fed Chair Marriner Eccles, which were featured in this recent post by Thorvald Grung Moe, another conference participant.  Skidelsky also discussed his new book, How Much Is Enough? (Amazon link), which is coauthored by Edward Skidelsky.

As for myself, I presented my most recent Levy Institute working paper and two example computable documents based on the model. The documents, which allow one to experiment with the model, along with links to the paper, appear in this May post.*  A somewhat skeptical Marc Lavoie, Fred Lee, and Sunanda Sen asked questions during the Q and A. After the session, Davidson was kind enough to bring up a few important issues that did not figure in my paper and presentation, including the key role of household credit, which has, however, been an important part of some previous work by me and other macroeconomists at the Institute (like this 2007 brief on the potential for a mortgage crisis, which I coauthored with Dimitri Papadimitriou and Gennaro Zezza).

*Note: The post is now slightly revised.- G.H., October 3.

Comments


Why Time Poverty Matters

Michael Stephens | August 20, 2012

(Updated)

by Rania Antonopoulos and Michael Stephens

Poverty is often measured by the ability to gain access to some level of minimum income, based on the premise that such access ensures the fulfillment of basic material needs. But this approach neglects to take into account the necessary (unpaid) household production requirements without which basic needs cannot be fulfilled. In fact, because the two are interdependent, evaluations of living standards ought to consider both dimensions; otherwise, the poverty numbers produced by statistical agencies and used by policy makers are flatly wrong.

Consider, for instance, two identical households of two adults and two children whose annual household incomes are also identical.  In the first household, while the mother or father works and brings in all the income, the other spouse is a stay-at-home parent that raises the children. In the second household, both adults are employed and, as it turns out, they work long hours because their hourly wages are relatively low. Nonetheless, they pull in the same income as the first household (with only one adult working). Income-wise, the two households are identical. What differentiates them is “time”: the first household has an adult with ample amounts of time to devote to cooking, maintenance work, raising the children, etc. The second household does not: it faces a time deficit in that there are not enough hours in the day to work for pay, commute, do the shopping, and then clean, cook, supervise the kids, iron the clothes, etc. This household must either buy the “missing” but essential goods and services or learn to do without. Some households facing time deficits earn sufficient income that allows them to hire a nanny or send the kids to a childcare center; to pay for a domestic worker who can clean the house and prepare home-cooked meals, etc. But others cannot. Simply put, they do not earn enough to afford market substitutes. The second household, as compared to the first one, suffers from material deprivations that are invisible, and hence their poverty, real as it may be, remains hidden from the policy radar.

With the support of the United Nations Development Programme, Ajit Zacharias, Rania Antonopoulos, and Thomas Masterson have developed an analytical and empirical framework that includes unpaid household production work in the very conceptualization and calculations of poverty: the Levy Institute Measure of Time and Income Poverty (LIMTIP). Based on this new analytical framework, empirical estimates of poverty are presented and compared with those calculated according to the official income poverty lines for Argentina, Chile, and Mexico. In addition, an employment-generating poverty-reduction policy is simulated in each country, and the results are assessed using the official and LIMTIP poverty lines.

Clearly, while employment is the key to escaping poverty for some households, for many others, according to our study, it is no answer at all.  Due to low wages, even if time-deficits are not newly created, some households in our study end up joining the working poor. Perversely, for others, as low wages combine with household production time deficits, they end up trading one type of poverty (time) for another (income). Unless supplemented by a living wage policy, regulation or reduction of working hours, and interventions that reduce household production time requirements (childcare, eldercare, after school programs), the newly employed cannot but replicate pre-existing patterns of inequalities and deprivation.

Comments


Try Out a New Macro Model and a New Technology

Greg Hannsgen | May 30, 2012

You wonder what will happen when markets finally start working. How about, for example, a market that changes prices and wages quickly in response to fluctuations in demand? In a mixed economy with a government that tries to provide fiscal stimulus as needed, will it be of help to move toward such fast-adjusting markets? The two interactive diagrams in this post are based on figures 9a, 9b, 10a, and 10b in a Levy Institute working paper of mine called “Fiscal Policy, Unemployment Insurance, and Financial Crises in a Model of Growth and Distribution,” which was issued just this month and posted on the Institute’s site (math content somewhat crucial).

Each of the two figures shows one pathway followed by an imaginary economy. The pathways are computed by simulating a heterodox model, using a set of parameters as well as a starting point for each of the following variables: capacity utilization, public (government) production, the markup on labor costs used by businesses to calculate their prices, and the size of the labor force. As I explain in the paper, my parameter choices are not based on econometric estimates, but rather on a rough sense of what might be reasonable for a developed economy. In a moment, a new technology will give you a chance to see the impact of varying one of these assumed numbers. In fact, this post represents the first use on this blog of Wolfram’s interactive cdf format. You’ll need a free cdf reader and browser plug-in, which are downloadable at this link, if you don’t already have them.

The pathway shown in the figure just below is followed by public production, capacity utilization, and the markup. As shown, the pathway leads gradually upward in the figure toward an endless orbit called a “limit cycle.” The stabilizing effects of fiscal policy seem to be creating a steady, repeated elliptical pattern.
[WolframCDF source=”http://blogs.bard.edu/multiplier-effect/files/2012/10/blog-cdf-1-revised.cdf” CDFwidth=”435″ CDFheight=”468″ altimage=”http://blogs.bard.edu/multiplier-effect/files/2012/10/blog-cdf-1-alternative-image-rev.png”]

Now, move the lever above the diagram to the right by clicking and dragging with your mouse (or similar move with a touchpad or whatever hardware you have). As you move the lever to the right, you are increasing a parameter that controls the speed at which the markup changes in response to high or low levels of customer demand. continue reading…

Comments


Did Tax Reform Contribute to Soaring CEO Pay?

Michael Stephens | May 16, 2012

Mark Thoma has posted the English transcripts of a threepart interview of James Galbraith by the German website NachDenkSeiten.

In the first interview there is a brief exchange with Roger Strassburg in which Galbraith discusses the idea that the 1986 tax reforms, which followed the “lower the rates, broaden the base” mantra that we’re still hearing from lawmakers, may have contributed to dramatic increases in executive salaries:

JG: In the U.S. In the 1980’s, the progressive reform which was developed by Bill Bradley and Dick Gephardt in Congress was to reduce the top tax rates by extending the base, because the system of very high marginal rates was so riddled with loopholes and exemptions that top earners by and large didn’t pay it unless they were of a very peculiar type, for example a celebrity athlete like Bill Bradley himself or Jack Kemp, who was also in the Congress at the time. They paid very high rates on that sort of straight salary income that they had. But if you were in any kind of business activity, you had a depletion allowance or timber allowance or some other damn thing that got you out of that.

RS: That seems to kind of be the way that things always run, though, that wages and salaries end up getting taxed higher than anything else. It seems to happen in every country.

JG: That may very well be, but the point of the ’86 act was to reduce the rates at the top, but to expand the base such as to be revenue-neutral, which it largely was. I think the long-term implications of the ’86 act are only now being recognized in the economics profession. A major thing that it did was to – and that’s true also of the earlier Reagan cuts – was to create a strong incentive for corporations to shift income directly to their chief executives. I think the CEO boom was partly an artifact of the reduction of marginal tax rates, and that had very pernicious effects on corporate governance in the United States. I wrote about this in a previous book, in The Predator State, and I’m now beginning to see some commentary. I know that Thomas Piketty has come to the same conclusion.

[I]f you have a high marginal rate, then you have an incentive to retain earnings in the corporation and pay the corporate tax rate and then to use the retained earnings in ways that add indirectly to the consumption of your top executives. You build a skyscraper with lovely penthouses in it, you have corporate aircraft, you have the whole aspect of this that characterized the way the big corporations presented themselves in the 50’s and 60’s in the United States. And they stopped building skyscrapers – when was the last time one was built? Probably the World Trade Center in 1970. There was very, very little after that, and corporations started building basically campuses, which are much cheaper, and instead funneling the money directly into the pockets of their chief executives.

Jens Berger then plays devil’s advocate and offers up the familiar alternative theory that these compensation increases are simply a “normal market effect”: continue reading…

Comments


Galbraith: Addressing Inequality Means Addressing Instability

Michael Stephens | May 3, 2012

Levy Institute Senior Scholar James Galbraith was interviewed by the Washington Post‘s Brad Plumer about his new book Inequality and Instability:  A Study of the World Economy Just Before the Great Crisis.  Galbraith explains that the rises in inequality we’ve witnessed globally since the 1980s can be traced to changes in finance and the macroeconomy (“when something’s happening at the same time around the world, in different countries that are widely separated, that’s a macro issue”):

Between the end of World War II and 1980, economic growth in the United States is mostly an equalizing force, and job creation isn’t dependent on rising economic inequality. But after 1980, economic booms and rising inequality go hand in hand. So what’s going on? In 1980, we really went through a fundamental transformation. We stopped being a wage-led economy with a growing public sector that was providing new services. Programs like Medicare and Medicaid were major drivers of growth in the 1970s.

Instead, we became a credit-driven economy. What the evidence in the U.S. shows is that the rise in inequality is associated with credit booms, which are often periods of great prosperity. We had one in the late 1990s with information technology and one in the 2000s with housing, before everything fell apart. But this is also a sign of instability — the crash that follows is very ugly business. If we’re going to go forward with growth on a more sustainable basis, then controlling inequality and controlling instability are the same issue. One is an expression of the other.

Read the interview here.

The Real News Network also featured a three-part interview with Galbraith (videos assembled here).

Comments


Hudson: Where Is the Leisure Society?

Michael Stephens | April 26, 2012

From a February 2012 presentation delivered by Research Associate Michael Hudson:

Suppose you were alive back in 1945 and were told about all the new technology that would be invented between then and now: the computers and internet, mobile phones and other consumer electronics, faster and cheaper air travel, super trains and even outer space exploration, higher gas mileage on the ground, plastics, medical breakthroughs and science in general. You would have imagined what nearly all futurists expected: that we would be living in a life of leisure society by this time. Rising productivity would raise wages and living standards, enabling people to work shorter hours under more relaxed and less pressured workplace conditions.

Why hasn’t this occurred in recent years? In light of the enormous productivity gains since the end of World War II – and especially since 1980 – why isn’t everyone rich and enjoying the leisure economy that was promised? If the 99% is not getting the fruits of higher productivity, who is? Where has it gone?

Read the rest here at Naked Capitalism.

Comments


The Levy Institute Measure of Time and Income Poverty

Thomas Masterson | March 23, 2012

I’d like to take a moment to give a brief report on some research that my colleagues Ajit Zacharias, Rania Antonopoulous, and I have been working on as a result of collaboration between the Levy Economics Institute and United Nations Development Programme (UNDP) Regional Service Centre for Latin America and the Caribbean (RSCLAC), particularly the Gender Practice, Poverty, and Millennium Development Goals (MDG) Areas. It addresses an identified need to expand our understanding of the links between income poverty and the time allocation of households, and between paid and unpaid work. Policies to combat poverty and promote equality require a deeper and more detailed understanding of the linkages between conditions of employment, unpaid household production, and existing arrangements of social provisioning—including social care provisioning.

Income poverty is customarily judged by the ability of individuals and households to gain access to some level of minimum income based on the premise that such access ensures the fulfilment of basic material needs.  However, this approach neglects to take into account the necessary (unpaid) household production requirements, without which basic needs cannot be fulfilled. Households differ in terms of their household production requirements and also in terms of the time their members have available to meet the requirements, so it should not be assumed that all households can meet these requirements. In order to promote gender equality, it is imperative to understand how labor force participation and earnings interact with household production responsibilities, as it is already well established that women contribute their time disproportionately to unpaid work.

We provide an analytical and empirical framework that includes unpaid household production work in the concept and measurement of poverty. Our approach shows that awareness of gender differences (especially in unpaid work) can bring to the forefront a ‘missing’ but key analytical category that allows for an improved measurement of poverty, and a deeper and more precise poverty classification of households and individuals. Future posts will delve more into policy ramifications of this work. In this post, I want to report on two of the headline results of our research.

Our alternative measure is a two-dimensional measure of income and time poverty, which we refer to as the Levy Institute Measure of Time and Income Poverty (LIMTIP). Time poverty, especially when coupled with income poverty, imposes hardships on the adults who are time-poor as well as their dependents, particularly the children, elderly, and sick. Income poverty alone does not convey enough useful information about their deprivation. Our measure can shed light on this phenomenon. My colleague Ajit Zacharias has published a working paper that lays out the theoretical underpinnings of the measure, and I have a working paper that outlines the methods used to construct the data sets we used to create the measure for Argentina, Chile, and Mexico.

The first important result of our project is that the size of the hidden poor, namely those with incomes above the official threshold but below the LIMTIP poverty line, is considerable in all three countries (Table 1). The LIMTIP income poverty rate for Argentina is 11.1 percent, compared to 6.2 percent for the official poverty line. For Chile, adjusting for time deficits increases the poverty rate to 17.8 percent from 10.9 percent for the official line. And in Mexico, the poverty rate increases to 50 percent from an already-high 41 percent. This implies that the households in hidden poverty in Argentina, Chile, and Mexico comprise, respectively, 5, 7, and 9 percent of all households.

The second important result of taking time deficits into account is that it dramatically alters our understanding of the depth of income poverty. The average LIMTIP income deficit (the time-adjusted poverty line minus household income) for poor households was 1.5 times higher than the official income deficit in Argentina and Chile and 1.3 times higher in Mexico. Thus, official poverty measures grossly understate the unmet income needs of the poor population. From a practical standpoint, this suggests that taking time deficits into account while formulating poverty alleviation programs will significantly shift both the coverage (including the ‘hidden poor’ in the target population) and the benefit levels (including the time-adjusted income deficits where appropriate).

Table 1 Official, LIMTIP, and ‘Hidden’ Poverty Rates and Number of Poor (thousands)

Official income poverty

LIMTIP income poverty

‘Hidden poor’

Number

Percent

Number

Percent

Number

Percent

Argentina

60

6.2

107

11.1

47

4.9

Chile

165

10.9

271

17.8

106

6.9

Mexico

10,718

41.0

13,059

50.0

2,341

9.0


Comments