What’s new about QE?
After its last meeting, the Federal Open Market Committee, which makes decisions about Federal Reserve monetary policy, decided to keep its holdings of long-term securities constant. The Fed was forced to look again at this issue because borrowers have been paying off the long-term debt securities already in its portfolio. This maturing debt consists mostly of Treasury bonds, mortgage-backed securities, and Fannie Mae and Freddie Mac bonds, most of which were acquired quite recently. The Fed will reinvest the repayments in more long-term Treasury bonds instead of allowing its balance sheet to shrink.
Some have referred to the Fed’s acquisition of certain assets not normally seen on its balance sheet by the special term “quantitative easing,” or QE. This term is perhaps somewhat misleading, because it implies a sharp distinction between the recent policies to which it refers and the Fed’s more typical manipulations of the federal funds and discount rates. But, surprise, the new policy actions also involve interest rates, albeit ones that the Fed had not attempted to directly influence in many years when it began QE in 2008. Let’s hear what Ben Bernanke said at a conference last week:
….changes in the net supply of an asset available to investors affect its yield and those of broadly similar assets. Thus, our purchases of Treasury, agency debt, and agency MBS [mortgage-backed securities] likely both reduced the yields on those securities and also pushed investors into holding other assets with similar characteristics, such as credit risk and duration. For example, some investors who sold MBS to the Fed may have replaced them in their portfolios with longer-term, high-quality corporate bonds, depressing the yields on those assets as well.
In other words, the Fed is buying long-term securities mainly as a means of reducing the interest rates paid by the federal government and other borrowers when they issue long-term debt. These rates are crucial because many large purchases are paid for over a long period of time. These include homes and large-scale corporate investments such as new factories, which are usually expected to yield revenues over a stretch of many years. Of course, the Fed has not set an explicit target for any long-term interest rates. But it certainly did that during and immediately after World War II, which was the last time the federal debt was so large as a percentage of GDP. (Interestingly, during its history, the Fed has not always publicly committed itself to any interest-rate target at all.)
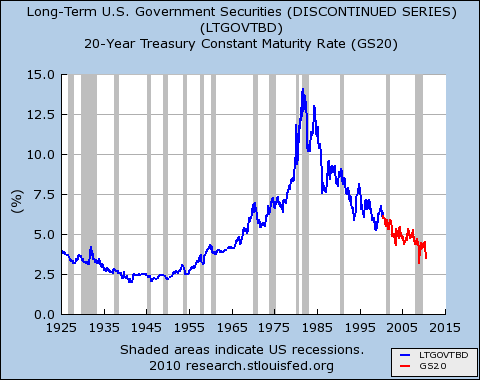
This graph, which shows interest rates on long-term securities issued by the federal government, offers some historical perspective on just how low interest rates are:
The figure depicts two data series maintained by the Federal Reserve, which I have had to splice together because neither series covers the entire time period shown in the graph, January 1925 to July 2010. It shows that throughout World War II and until 1953, the Fed kept long-term interest rates below 3 percent, which helped keep the cost of federal debt low. Of course, to do this, the Fed had to purchase many long-term government bonds. We wonder what will happen next.
(Graph updated with August 2010 data point and resized for readability September 15, 2010.)


 ShareThis
[…] summer, this blogger posted a graph showing the path followed by U.S. long-term interest rates since 1925. There has been some […]