Archive for the ‘Employment’ Category

January Employment Report: Broader Effects of Seasonal Adjustment

Greg Hannsgen | February 16, 2011


(Click figure to enlarge.)

Two Fridays ago, I blogged about some newly released Bureau of Labor Statistics (BLS) data from a monthly household survey. I was surprised later to see that Multiplier Effect was one of only a handful of websites to mention that non-seasonally adjusted data showed vastly different and perhaps more disturbing results than the widely reported deseasonalized numbers: a flat unemployment rate, a sharp fall in employment, and a rise in the number of people unemployed. All of the numbers I discussed were based on traditional concepts of unemployment, which have been familiar to newspaper readers for decades.

It is important to put such survey results in context, and I have now had time to finish putting together some further information on the effects of seasonal adjustment on the numbers released early this month. While the standard version of the unemployment rate is widely reported and debated, it does not include potential workers who are not considered to be in the labor force because they have not recently been looking for work. If the labor market were stronger, most of these individuals would almost certainly return to the workforce and find work. Hence, it is interesting to look at a broader measure of unemployment that includes at least some of those out of workforce who want to work, but have not recently been searching for a job.

One such statistic is the BLS’s own U-4 measure of “labor underutilization,” which includes those deemed to be “discouraged workers,” in addition to the unemployed. The seasonally adjusted version of U-4 dropped from 10.2 percent in December to 9.6 percent in January. In contrast, the non-seasonally adjusted version of this index rose from 9.9 percent to 10.4 percent, according to the BLS. Hence, the story we have told in blog entries over the last two weeks also seems to have some implications for a more comprehensive measure of the human cost of weakness in the labor market.

The simple methodology that I used in my most recent post on the BLS report to calculate the impact of seasonal adjustment on the month-to-month change in the unemployment rate can be extended to a broader but unofficial index. This time, my answer will be somewhat less exact, because we do not have complete information about the potential impact of the 2011 adjustments to BLS population estimates on my new calculations .

Using data from Table A-1 of the BLS news release, as well as partial information on the effects of population adjustments on the January data from Table C of the release summary, we can find the contribution of seasonal adjustment to the apparent change in the following seasonally adjusted makeshift unemployment index:

number unemployed + number out of the labor force who want to work

divided by

labor force + number out of the labor force who want to work

The BLS does not separately report this statistic to our knowledge, but it is similar in spirit to several other alternative gauges of labor underutilization reported in Table A-15 of the employment report. Hence, we report our findings with the caveat that the BLS certainly might not endorse the use of this improvised measure.

What we find is interesting: seasonally adjusted BLS numbers from table A-1 imply that our broad unemployment index dropped from 13.0 percent in December to 12.7 percent last month. These are large numbers indeed. However, removing the effects of seasonal adjustment on the underlying raw numbers, the broad index probably would have risen by at least .9 percent, from 13.0 percent in December to between 13.9 and 14.0 percent. Hence, using a similar methodology to last week’s post, one finds that the effect of seasonal adjustment on the change in the broad unemployment measure is even greater than the corresponding effect on the change in the usual measure.

By the way, other data in the recent government report suggest that this difference between seasonally adjusted and non-seasonally unadjusted figures can largely be accounted for by temporary layoffs whose impact on the data was removed by adjustment procedures.  In other words, many workers were laid off last month, but were not counted in the most widely reported January unemployment figures, because large numbers of layoffs are not unusual for that time of year.

In fact, the historical record shows that the effects of BLS seasonal adjustment procedures are often especially large for the January release, resulting in substantial downward statistical adjustments to the recorded change in the unemployment rate from the previous December. This effect is not often noted in the media, though non-seasonally adjusted BLS figures are made available in the same report as the headline unemployment rate. The blog seekingalpha wrote about this phenomenon last winter. The figure at the top of this post is similar to a graphic appearing in that blog entry.

Edited slightly for clarity and readability Feb. 16 at 12:11 pm.

Comments


Seasonal Adjustments Roughly Account for Reported Drop in Unemployment Rate

Greg Hannsgen | February 6, 2011

In Friday’s post, I pointed out that unemployment and employment numbers announced by the BLS had apparently been changed greatly by the process of adjusting for typical seasonal changes. These adjustments are meant to account, for example, for the fact that retail business is generally stronger than usual during the holiday season at the end of each year. Friday’s widely reported unemployment drop to 9.0 percent in January from 9.4 percent the previous month was a figure that had been seasonally adjusted by the BLS to remove such normal seasonal effects. Also reported by the BLS Friday in the same set of documents were non-seasonally adjusted numbers that showed an increase in unemployment from 9.1 percent in December 2010 to 9.8 percent in January 2011. Few internet news outlets seem to have reported these latter percentages or the underlying raw numbers used to calculate them. On the other hand, many blogs and other news sources mentioned that adjustments had been made to the official numbers to reflect improved estimates of population growth from recent surveys, resulting in a problem with comparing January’s numbers with December’s. Friday morning’s blog post contained a qualifying statement to the effect that these population-related statistical adjustments had probably affected the un-seasonally adjusted numbers that I reported in the same post. Here is what I have been able to figure out about the importance of these two factors in creating such a large difference between the seasonally adjusted and non-seasonally adjusted one-month changes in the unemployment rates reported by the BLS.

The seasonally adjusted drop in number of unemployed people was -622,000, according to the BLS figures reported Friday. Table C in the accompanying news release estimated that annual changes in population estimates made by the BLS each January had this year magnified the reduction in unemployment from December to January by +32,000 individuals, leaving a true drop of perhaps −590,000, once one removed the effect of the population adjustments. On the other hand, non-seasonally adjusted figures from the same economic news release (Table A-1) showed an increase in the number of unemployed people of +40,000. Hence, one can deduce that, at least to a rough approximation, seasonal adjustment resulted in a much larger swing than population-related adjustments in figures reported in the headlines yesterday. Namely, about 630,000 more people were unemployed last month, once one puts back in the effects of typical seasonal changes in unemployment, as estimated by the BLS, resulting in a swing in the estimated figures of approximately +.4 percent of the labor force. In other words, the reported reduction in the unemployment rate from 9.4 percent to 9.0 percent in January derived from household survey data can be accounted for almost entirely by seasonal adjustments applied by the BLS.

Minor corrections for readability made to the post above approximately 2:00 pm, February 6 by G. Hannsgen

Comments


Beneath the Surface, Some Disappointing Unemployment Data

Greg Hannsgen | February 4, 2011

A note on the unemployment figures released earlier this morning by the Bureau of Labor Statistics (BLS), reporting the results of a January survey of U.S. households: The seasonally adjusted unemployment rate fell from 9.4 percent in December to 9.0 percent last month, a healthy improvement. On the other hand, before seasonal adjustment, the unemployment rate rose from 9.1 percent in December to 9.8 percent in January. Raw data that are not seasonally adjusted show that the number of unemployed Americans rose by 940,000, while the number employed fell by 1,560,000. New adjustments for population changes, introduced by the BLS this month, affected these numbers by an amount that is possibly very large and that is not yet known to me. This latter problem probably affects raw numbers more than the overall unemployment rate. The seasonally unadjusted numbers used in this blog post can be found in table A-1 of the recent economic news release from the BLS.

Comments


Education, earnings and age in the Great Recession

Thomas Masterson | January 27, 2011

Reading the back and forth between Brad deLong and David Leonhardt over the structural versus cyclical nature of unemployment during the Great Recession, a question nagged at me, spurred by this quote from Leonhardt:

The data that the Bureau of Labor Statistics released on Thursday gives me a chance to explain why I disagree. In short, the relative performance of more educated and less educated workers over the last few years has not been the typical pattern for a recession. Less educated workers, by many measures, are faring worse than they ever have.

The ratio of the typical four-year college graduate’s pay to a typical high-school graduate’s pay hit a record in 2010 — 1.56. Since 2007, the inflation-adjusted median weekly pay of college graduates has risen 1.6 percent. The inflation-adjusted pay of every other educational group — high school dropouts, high school graduates and people who attended college but did not get a four-year degree — has fallen since 2007. The same is true over the last decade; amazingly, only college graduates have received a raise.

continue reading…

Comments


The impact of the recession on jobs

Gennaro Zezza | January 13, 2011

The Economic Policy Institute has produced an interesting analysis on jobs lost and recovered in U.S. post-war recessions.

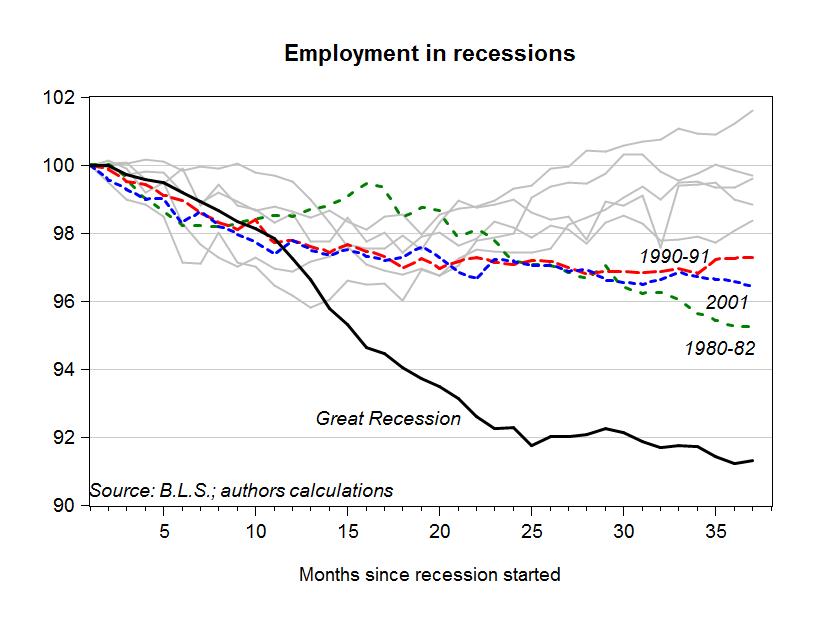
They show how many months were needed, since the beginning of a recession, to get back to the initial employment level. However, the working population is growing over time, so getting back to the employment level of, say, 12 months ago, would not be sufficient to restore the same employment and unemployment rates.
Employment in Recent U.S. Recessions
In our chart we assume that population grows at its annual average (around 1.4 percent), and calculate how long it took for employment to get “back on track”, i.e. we compare actual employment with what employment should have been, if jobs grew along with active population. With our modified chart, employment got back on track within three years only in the recession which started in 1969. In all other cases, employment was still below its pre-recession path after three years.

In the current (last?) recession, employment still has a long way to go before we can talk of a “recovery.”

Comments


Will the U.S. recover lost output and jobs?

Gennaro Zezza | January 12, 2011

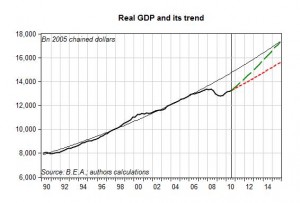
At the last meeting of the American Economic Association in Denver, Giuseppe Fontana discussed the theoretical arguments on whether the Great Recession will generate a permanent loss in output. He argued that, according to the dominant “New Consensus” theory, output should return to its historical path once the shock has been absorbed. Alternative, heterodox theories, suggest that the shock will have permanent effects.
U.S. Real GDP growth and trend
In the chart we plot U.S. real GDP along with its trend, estimated using a simple exponential function over the pre-recession period (from 1970 to 2007). The average growth rate in output over this period was slightly above 3 percent. The dotted red line plots the evolution of GDP, should it resume its average, pre-recession, growth rate. The red line therefore represents the idea that the recession will have permanent effects. The green dashed line has been drawn under the assumption that the economy gets back to its pre-recession growth path by the end of 2015.

Real GDP needs to grow at 5.2 percent from now to 2015, to achieve this result…

Comments


Federal Pay Rates Frozen; How High Are They Now?

Greg Hannsgen | December 1, 2010

Yesterday, the Obama administration announced that it wants to freeze wages and salaries earned by federal government employees in calendar years 2011 and 2012. Most federal workers might otherwise have received a cost-of-living raise at the start of the new year. There has been some controversy about whether these workers are overpaid. In this post, I report some information that I have gleaned from the web about the pay scale for most white-collar positions in the federal government, which is known as the “general schedule” (GS).

The government’s Office of Personnel Management (OPM) states that “the General Schedule (GS) classification and pay system covers the majority of civilian white-collar Federal employees (about 1.3 million worldwide) in professional, technical, administrative, and clerical positions…”

For 2010, the pay scale for federal GS employees is shown in the table below. This is the table for employees who work in geographic areas where the cost of living is not unusually high. An explanation of the table follows.

Grade Step 1 Step 2 Step 3 Step 4 Step 5 Step 6 Step 7 Step 8 Step 9 Step 10
1 17803 18398 18990 19579 20171 20519 21104 21694 21717 22269
2 20017 20493 21155 21717 21961 22607 23253 23899 24545 25191
3 21840 22568 23296 24024 24752 25480 26208 26936 27664 28392
4 24518 25335 26152 26969 27786 28603 29420 30237 31054 31871
5 27431 28345 29259 30173 31087 32001 32915 33829 34743 35657
6 30577 31596 32615 33634 34653 35672 36691 37710 38729 39748
7 33979 35112 36245 37378 38511 39644 40777 41910 43043 44176
8 37631 38885 40139 41393 42647 43901 45155 46409 47663 48917
9 41563 42948 44333 45718 47103 48488 49873 51258 52643 54028
10 45771 47297 48823 50349 51875 53401 54927 56453 57979 59505
11 50287 51963 53639 55315 56991 58667 60343 62019 63695 65371
12 60274 62283 64292 66301 68310 70319 72328 74337 76346 78355
13 71674 74063 76452 78841 81230 83619 86008 88397 90786 93175
14 84697 87520 90343 93166 95989 98812 101635 104458 107281 110104
15 99628 102949 106270 109591 112912 116233 119554 122875 126196 129517

Each row in the table shows the annual salary in dollars for a particular pay “grade.” The OPM explains GS pay grades as follows: “The General Schedule has 15 grades–GS-1 (lowest) to GS-15 (highest). Agencies establish (classify) the grade of each job based on the level of difficulty, responsibility, and qualifications required. Individuals with a high school diploma and no additional experience typically qualify for GS-2 positions; those with a Bachelor’s degree for GS-5 positions; and those with a Master’s degree for GS-9 positions.”

Each column of the table corresponds to a “step” within each pay grade. Employees who do not qualify for a promotion to a higher grade can sometimes move a step to the right along the row corresponding to their pay grade. According to the OPM, “Each grade has 10 step rates (steps 1-10) that are each worth approximately 3 percent of the employee’s salary. Within-grade step increases are based on an acceptable level of performance and longevity (waiting periods of 1 year at steps 1-3, 2 years at steps 4-6, and 3 years at steps 7-9). It normally takes 18 years to advance from step 1 to step 10 within a single GS grade if an employee remains in that single grade. However, employees with outstanding (or equivalent) performance ratings may be considered for additional, quality step increases (maximum of one per year).”

The usual annual pay raises for federal employees in this compensation system are explained next:

“The GS base pay schedule is usually adjusted annually each January with an across-the-board pay increase based on nationwide changes in the cost of wages and salaries of private industry workers.”

Also, “most GS employees are also entitled to locality pay, which is a geographic-based percentage rate that reflects pay levels for non-Federal workers in certain geographic areas…”

As an example of the locality pay earned by workers in many areas with high costs of living, here is the 2010 schedule for GS employees in the “New York-Newark-Bridgeport, NY-NJ-CT-PA” metropolitan area, one of the most expensive places to live in the United States:

Grade Step 1 Step 2 Step 3 Step 4 Step 5 Step 6 Step 7 Step 8 Step 9 Step 10
1 22916 23682 24444 25202 25964 26412 27165 27925 27954 28665
2 25766 26379 27231 27954 28268 29100 29931 30763 31594 32426
3 28112 29050 29987 30924 31861 32798 33735 34672 35609 36546
4 31560 32611 33663 34714 35766 36818 37869 38921 39973 41024
5 35309 36486 37662 38839 40015 41192 42368 43545 44721 45898
6 39359 40670 41982 43294 44605 45917 47229 48540 49852 51164
7 43738 45196 46655 48113 49571 51030 52488 53947 55405 56863
8 48439 50053 51667 53281 54895 56509 58124 59738 61352 62966
9 53500 55283 57065 58848 60631 62414 64197 65979 67762 69545
10 58916 60881 62845 64809 66774 68738 70702 72666 74631 76595
11 64729 66887 69044 71201 73359 75516 77674 79831 81988 84146
12 77585 80171 82757 85343 87929 90515 93101 95687 98273 100859
13 92259 95334 98409 101484 104559 107634 110709 113785 116860 119935
14 109022 112656 116290 119923 123557 127191 130825 134458 138092 141726
15 128241 132516 136791 141066 145340 149615 153890 155500 155500 155500

As a macroeconomist, I must note that freezing the pay of federal employees will be somewhat detrimental to the effort by the Federal Reserve and the Administration to prevent deflation and/or a double-dip recession, because this action will reduce consumer demand. Also, freezes of federal pay unfortunately could allow private sector employers to cut pay or at least avoid raising pay for some workers who are in the same occupations as the affected government employees. Similar problems can be expected in Europe, where some governments have recently cut wages and benefits for their employees.

The quotations in this post are from this page in the OPM website More details on the GS pay scale are available there. Links to a complete set of GS pay tables like the ones shown above can be found here.

Comments and responses below:

continue reading…

Comments


A moment to remember Hyman Minsky

Greg Hannsgen | September 23, 2010

Hyman P. Minsky, the renowned financial economist, macroeconomist, and Levy Institute distinguished scholar, was born 91 years ago today. A short bio of Minsky, along with links to many of his publications, can be found here. Minsky’s papers are collected at the Minsky Archive, which is housed at the institute. In April, we will be holding our 20th Annual Hyman P. Minsky Conference in New York City. I hope you enjoy these links to information about an economist who was and is very important to this institute.

Comments


New report JOLTS claim that extended benefits breed unemployment

Greg Hannsgen | September 8, 2010

US Private Sector Hires Layoffs Discharges and Quits Seasonally Adjusted

Last week, my colleague Tom Masterson commented on an op-ed piece by Robert Barro, which argued that much of the U.S. unemployment problem―perhaps 2.7 percentage points of the June unemployment rate of 9.5 percent―could be attributed to the availability of extended unemployment insurance benefits.

According to Barro’s argument, huge numbers of people are out of work by their own choice. In fact, data released yesterday from the Job Openings and Labor Turnover Survey (JOLTS) suggest that something very different is going on. Some economic theories about unemployment are based on the notion that workers use more of their time for leisure activities or full-time job search at times when their wages or salaries are relatively low. An example would be an  ice-cream vendor who takes time off on cool or rainy days because sales are expected to be weak at such times. Along these lines, Barro has recently argued that Congressional extensions of benefit eligibility have made paid work less desirable for recipients whose checks might have been discontinued in the absence of new legislation.

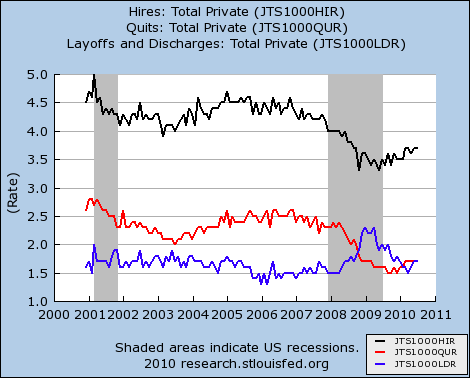
The figure above shows seasonally adjusted JOLTS data on the private sector for December 2000 through July 2010. This monthly survey, conducted by the Bureau of Labor Statistics, covers approximately 16,000 nonagricultural businesses. The black line shows that the estimated “hire rate” in the private sector was 3.7 percent in July. In other words, there were approximately 3.7 new hires in private industry for each 100 current employees in that part of the economy. This compares to 4.6 as recently as late 2006.

The other data series shown in the figure may shed more light on the validity of the leisure/job search explanation for high unemployment. The blue line shows the rate of “layoffs and discharges,” a category that includes all reported involuntary separations that were initiated by the employer. This figure peaked last spring at about 2.3 percent of the private-sector workforce and had fallen to a more typical level of 1.7 percent by July. The 2.3 percent figure, reached twice in early 2009, is the highest layoff and discharge rate for the period shown on the graph. Indeed, the graph shows a prolonged period beginning in late 2008 during which the rate of involuntary separations was well above the historical norm.

Finally, the “quit rate,” shown in red, is the percentage of workers who resign in the survey month, in this case July. For the private sector, this statistic fell from 2.3 percent at the start of the recession in 2007 to 1.7 percent in July. Hence, there has been only a modest increase in this rate since it bottomed out late last year at 1.5 percent. Recent low readings stand in stark contrast to an average observation of 2.4 percent for the period spanning December 2000 to November 2007. Such low quit rates strongly suggest that fewer rather than more workers than usual have been finding new jobs or resigning to take time off for job search, vacations, or home-based activities. The new statistics depict a job market in which many employees are losing their jobs or at least believe that it will be very difficult to find new jobs if they leave their current ones.

Comments


Less stimulating than it should be

Thomas Masterson | September 7, 2010

The Free Exchange blog calls President Obama’s proposed $50 billion infrastructure stimulus “A New Hope.” Our research begs to differ. We find that spending $50 billion on infrastructure would create little more than half a million new jobs. That’s not an inconsiderable number, but it’s a drop in the bucket compared to the 14.9 million who were unemployed in August (according to the last employment situation report).

There are strong arguments to made in favor of infrastructure spending. But if the administration were to spend the same amount on social care (child care, home health care, etc.), the employment gain would be more than twice as great, reaching nearly 1.2 million.Those would be lower paying jobs, but they would go to individuals further down the economic ladder–the people, in other words, most in need of help and most likely to provide further stimulus by promptly spending their earnings.

Perhaps the president’s latest proposal is merely a political trap Obama is setting for the Republicans, giving them yet another opportunity to ostentatiously oppose something popular. If so, good luck. But after the weaker-than-needed stimulus package last year, which is now running out of gas in terms of boosting employment, this proposal won’t provide much additional job growth. Half measures, as the saying goes, avail us naught. And this proposal is much less than half of what is needed.

Comments