Archive for the ‘Employment’ Category

If this was a recovery…

Greg Hannsgen | August 12, 2011

It remains to be seen if the stock market collapse of the past three weeks or so will be followed by very bad GDP numbers and renewed job losses. How far did the recovery from the Great Recession get before the big relapse of stock-market volatility?

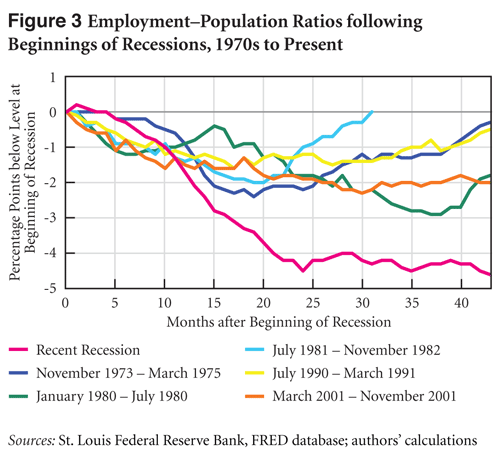
A new Levy Institute one-pager features some graphs that reveal a very weak recovery indeed, or even the start of a prolonged slump in economic growth and job creation, despite the fact that the recession ended in June 2009 by semi-official reckoning. Figure 3 in the new publication illustrates the country’s lack of progress in reversing recession-driven declines in the ratio of employment to the total civilian working-age population. Indeed, the figure shows that, according to the broadest figures available, the current employment problem is unprecedented in a period spanning back 40 years in terms of its overall size at the national level.

As the new one-pager states, Figure 3 shows

separate lines for the past six US recessions. Each line traces the path of the employment-to-population ratio relative to its level in the first month of each recession. The pink line corresponds to the most recent recession; it shows that, as of July, the ratio stood at 58.1 percent—4.6 percent less than at the recession’s start, 43 months earlier.

Comments


Beyond Infrastructure

Michael Stephens | August 10, 2011

The topic of the moment, in the wreckage of the debt ceiling fight and the S&P downgrade, is to ask what the government can do to boost employment.  The data from Gennaro Zezza’s most recent post suggest that one of the answers to this question is “stop firing so many people.”

Beyond stemming the losses in government payrolls, what else can be done to actively create jobs?  (All new suggestions for boosting aggregate demand or dealing with the unemployment problem should include Peter Orszag’s just-shy-of-inspiring disclaimer from his latest Bloomberg column:  “To those who will scoff that even these proposals are politically impossible, I’d note that the scope for constructive legislation has now become so narrow and the costs of doing nothing so high, we need to make ambitious proposals and hope that the legislative constraints can be adjusted.”  Huzzah?)

Jared Bernstein points out that the administration’s current proposals contain two ideas that would maintain demand rather than boosting it, and one idea that would stand a chance of helping:  investing in repairing roads and bridges.  Due to the relative capital intensity of this last item, however, Bernstein suggests that an infrastructure program focused on repairing and retrofitting schools would have a more dramatic employment effect.

The Levy Institute’s Rania Antonopoulos, Kijong Kim, Thomas Masterson, and Ajit Zacharias have looked at another solution to this problem.  Their research concludes that while the case for physical infrastructure investment is compelling, there is a public works approach that would deliver an even more impressive bang for the buck:  investment in social care.

The research group proposes a direct job creation program that puts people to work addressing our deficits in early childhood care and home-based healthcare for the elderly and chronically ill.  They modeled a $50 billion investment in both infrastructure and community-based social care delivery, and found that—due in large part to the higher labor intensity of care work—every dollar invested in social care would have twice the employment impact as a dollar of infrastructure investment.

Their Working Papers and Public Policy Brief can be read here, here, and here.  For an abbreviated version, see the recent One-Pager.  (For those of you who are (a) new to the Levy Institute website, and (b) short on time, One-Pagers are short, topical pieces that highlight policy-relevant research at the Institute—and they are indeed one page.)

Comments


To Cut the Debt, Create Jobs

Gennaro Zezza | August 9, 2011

While public discussion in the last several weeks has been absorbed by the debt ceiling saga, and in the coming weeks will probably focus on the S&P downgrade, employment (or lack thereof) is still a major problem. Our employment problem is one of the main factors contributing to a sizeable government deficit and growing public debt.

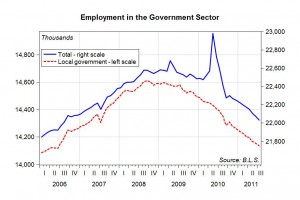
For all those who think that government has expanded wildly during the recession as a result of the fiscal stimulus, think again. The chart above shows that of the 7.3 million jobs lost since November 2007, 300,000 of those were lost in the government sector; more specifically in local government, which accounts for about 64% of the employment in the government sector. Local governments have to run a balanced budget, and when a recession hits and their tax receipts decline, they have to cut expenses—which means fewer jobs. If the federal government were to embrace similar balanced-budget policies, its ability to support a struggling economy would be severely curtailed.  It would not only be unable to create jobs directly; it would struggle to even maintain its existing workforce.

The chart below shows one measure of the employment rate, computed as a percentage of the working-age population. This share rose in the post-WWII period with the increase in the female participation rate. It stabilized in the twenty years before the Great Recession at around 63%, dropped to 58% during the recession, and has remained roughly stable in the last ten months. To see what the prospects are for employment going forward, we have made some simple calculations. continue reading…

Comments


Self-Flagellation, Revisited

Michael Stephens | August 3, 2011

Following up on a previous item, Macroeconomic Advisers have updated their analysis in response to the most recent debt ceiling deal.  The results:  no good news, and some serious uncertainty in the probable effects on growth (though not the sort of “uncertainty” the conventional wisdom is persistently telling us we should care about).

In 2012, they estimate that the fiscal drag resulting from budget cuts is likely to hover around 0.1 percentage points.  If that strikes you as a minor blip, note that they have not included multiplier effects in their estimates.  The Economic Policy Institute, using standard multipliers, estimate that the ultimate damage in 2012 would amount to a reduction of 0.3 percentage points in GDP, or, if that still doesn’t get your attention, around 323,000 fewer jobs.

When adding in the effects of the expiration of the unemployment insurance extensions (528,000 fewer jobs) and the payroll tax cuts (972,000 jobs), EPI suggest that we should expect the economy to shed somewhere on the order of 1.8 million jobs as a result of these policy choices.

While the administration, via Tim Geithner op-ed, signaled today that it would like to extend both the unemployment insurance and payroll tax cut measures, as well as to initiate new infrastructure investments, it takes a certain amount of imagination to see how any of these measures—even the extension of tax cuts—could get through Congress in the current climate.

If that still doesn’t faze you, consider that in 2013, as a result of the debt ceiling deal, things really start to get dicey. continue reading…

Comments


A longer-term Keynesian approach to macro policy

Greg Hannsgen | July 29, 2011

Many influential mainstream Keynesian economists continue to support high deficits until the nation’s yawning jobs gap is closed. As Laura D’Andrea Tyson observes in a thorough and helpful blog entry posted this morning, this is not a fine-tuning problem requiring a careful weighing of priorities, given the current state of the job market:

Like many economists, I believe that the immediate crisis facing the United States economy is the jobs deficit, not the budget deficit. The magnitude of the jobs crisis is clearly illustrated by the jobs gap–currently around 12.3 million jobs.

That is how many jobs the economy must add to return to its peak employment level before the 2008–9 recession and to absorb the 125,000 people who enter the labor force each month. At the current pace of recovery, the gap will be not closed until 2020 or later.

In other words, we are not even close to full employment; moreover, as many have observed, inflation appears to be extremely low, with few signs that the stimulus measures taken up to now are bringing about an inflationary takeoff. Hence, it is straightforward to see the urgency of increasing job growth relative to worrying about rising prices, at least for the time being.

Parenthetically, while macroeconomists rightly devote a great deal of attention to these cyclical issues, there are numerous pressing matters other than inflation and unemployment that figure in the recent budget debates in Washington. Many of these issues are at stake in the individual spending cuts and tax-code changes now being debated. Some of the changes being contemplated involve very large amounts of money and programs that are crucial to many people. There is a great danger that these concerns will be lost in the rush to meet an artificial deadline that could after all be eliminated immediately by a single act of legislation, with or without “action” on the deficit.

With a near-consensus in the moderate camp on the need for temporary monetary and fiscal stimulus, I think it might be useful in a policy-oriented forum like this one to point out some of the potential contributions of more encompassing Keynesian approaches and of various post-Keynesian alternatives toward a better set of policies. One of the main issues dividing the mainstream Keynesian approach from these more-radical departures is the importance of the distinction between the short and long runs in deciding the role of macro policy in ending a recession or depression.

Throughout the debate, the moderate Keynesians, who have managed to carry the day many times, have argued that Keynesian stimulus should come before serious belt-tightening designed to reduce the federal debt over the long haul.  The rationale has been that “this too shall pass” in the longer run. But with weakening or mediocre economic data prevailing again recently, the long run appears to once again be the long run. The economy’s power to correct its own course is very much in doubt, but so also are the curative powers of modest stimulus bills in the medium and long runs.

A more helpful role for government might be open, once there was an admission that more-permanent action is needed to solve an unemployment problem that no longer seems to be purely cyclical in nature, but nonetheless to clearly implicate a lack of aggregate demand. Such measures could include longer-term employment opportunities, as well as the creation of new mechanisms designed to automatically stimulate the job market whenever the economy begins to falter. In any case, the thought must be of longer-term policy-planning for adequate stimulus to both supply and demand.

Comments


Did problems with SSDI cause the Output-Jobs Disconnect?

Greg Hannsgen | May 6, 2011

Chart 1 (Click to enlarge.)

In a New York Times blog, Nancy Folbre recently discussed the alarming disconnect between economic growth and job creation in the United States. While the economy has been growing since the Great Recession’s end in 2009, the employment rate remains stuck at its December 2009 level of 58 percent. This percentage had reached 65 percent during the boom leading up to the 2001 recession—a level not seen since then. The slow recoveries of the job market after the last two recessions have fostered a concern among many that the link between economic growth and job creation has been severed, a phenomenon that might be called the American Output-Jobs Disconnect. Chart 1 at the top of this post illustrates this turning point in the employment rate (employed persons divided by population). The blue line shows the employment rate for males plunging from 71.9 percent in 2000 to 63.7 in 2010, while the red line depicts the rate for females falling from 57.5 percent to 53.6 percent during the same 11-year interval.

Reading an interesting proposal from the Center on American Progress (CAP) and the Hamilton Project to reform the Social Security disability program, also known as SSDI, I noticed this chart, which seemed relevant to the same topic.

Chart 2 (Click to enlarge.)

Chart 2 above shows that among men aged 40 to 59, employment rates for those who do not report having a disability were approximately the same in 2008 as they were in 1988, while the percentage of disabled men who are working fell from 27 percent in 1988 to 17 percent in 2008. It is remarkable that the decline in the employment rate for men aged 40-59 can be accounted for almost entirely by a fall in the employment rate for the disabled members of this group, at least for the period 1988–2008.

Another well-known fact seen earlier in Chart 1 is that employment rates for women rose dramatically until approximately the year 2000. In Chart 3 (just below this paragraph), also from the CAP-Hamilton proposal, one finds that what was true for women in general was not true for disabled women, at least in one age group. The employment rate for disabled women aged 40-59 was only 16 percent in 2008, compared to 18 percent in 1988.

CAP and the Hamilton Project argue in the paper that the long-run fall in the employment rate for disabled people can be blamed largely on the design of the Social Security disability program. This problem is one of the many issues that motivate the paper’s proposal for a “front-end” disability benefit. The proposed disability benefits are designed to be quickly obtainable after the onset of disability and to encourage a quick return to the workforce when one is possible.

More recently, this proposal, along with a number of other issues related to the Social Security disability program, were discussed in this article by Motoko Rich in the New York Times. The New York Times article quotes some experts who question the importance of problems with the Social Security disability program as factors in recent employment trends.

While reading Folbre’s blog post last week, I realized that a disabled–nondisabled breakdown of employment rates might also shed some light on the post-recession employment issue mentioned by Folbre.  To wit: did the recovery from the 2007–09 downturn improve employment rates for the disabled or nondisabled subgroups of either gender, in spite of the ongoing slump in the overall employment rates for both males and females of working age?  This question was addressed in a fascinating article in the BLS’s Monthly Labor Review (MLR) last fall, which focused on the thesis that the recession disproportionately affected the job-market prospects of disabled workers. The article found declining employment rates for both disabled and nondisabled Americans. We have created Chart 4 below using BLS data similar to those analyzed in the MLR article but for a broader age group, namely ages 16 to 64, and for an updated dataset.

Chart 4 (Click to enlarge.)

Given the findings reported in the MLR article, it is not surprising to find a sharp decline in employment rates for all four subpopulations depicted in Chart 4: male and female disabled people, as well as males and females without disabilities.

The data series shown in Chart 4 are among many pieces of evidence against any theory that the largest drops shown in our charts can be explained mostly by a structural or long-term change in disability policy. To wit: at least since 2008, the ongoing fall in the probability of being employed has strongly affected the job prospects of both disabled and nondisabled people of both genders. Also, the acceleration of the declines shown in Chart 1 starting in 2007, as well as the substantial decreases shown in Chart 4 for 2008 to the present, hints at an important and negative role for the recent recession and the weakness of the current recovery. Hence, a new government jobs program such as an employer-of-last-resort (ELR) program and/or other anti-recession measures—and not just long-term improvements in entitlement programs such as federal disability benefits—are still very much apropos.

(Thanks to Alex Bartik of the Brookings Institution for providing Charts 2 and 3 and to Brookings for permission to use these charts in this blog.)

Comments


Who has the lowest labor costs?

Greg Hannsgen | April 23, 2011

(Clicking on picture will make it larger.)

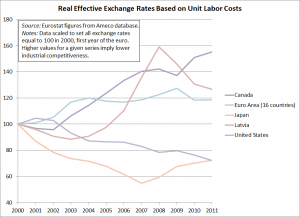
Floyd Norris has an interesting column in this morning’s New York Times. Earlier this week, I was getting ready with some observations similar to his, though I am sure I could not have done as good a job as he has in getting across the gist of the problem and presenting some evidence. Essentially, Norris shows that since the introduction of the euro in 2000, products from the countries now in fiscal crisis have lost competitiveness relative to German products in international markets. Norris presents data on competitiveness. His data is similar to the series depicted in the chart at the top of this post, but the data above are real exchange-rate indexes. The lines in my chart compare the competitiveness of various economies’ exports, taking into account not only differences in unit labor costs but also the values of their currencies relative to those of their trading partners. Norris’s graph and my own feature data from different economies.

Norris’s point is that Germany is an big exporter partly because it has reduced labor costs relative to its competitors. Meanwhile, according to Norris’s theory, the peripheral countries of Europe, such as Greece, Ireland, and Portugal, have become less competitive, as their labor costs have risen relative to those in Germany and other “core” European nations. And because of the common currency, these higher-cost countries cannot use a devaluation to regain competitiveness.

As all acknowledge, the issues involved are complex. One key critique of the current approach to policy embodied by the European Central Bank and European Union rules is that this game clearly has winners and losers, mostly the latter. Norris’s graphs show increasing trade deficits in Italy, France, Spain, as well as the aforementioned troubled economies. While there is no reason that all countries must lead at once, someone, in either government or in industry, must hire workers to produce goods or services if employment is to be increased. Current bailout agreements and big debts are leading to drastic cuts in government employment and wages, even as they bring protests from opposition parties in countries called upon to help fund bailouts. This has contributed to a situation in which unemployment is extremely high in much of Europe, while all are focusing on the need to cut government spending, seemingly ruling out new or enlarged Keynesian public works programs.

However, it must also be said that the notion of cutting wages and benefits is also hard to swallow for most Europeans. The countries currently in deep crisis are not known as having high real wages for rank-and-file workers. Also, wage cuts have a tendency to undermine domestic demand for consumer goods, but cannot accomplish the complex task of making a country’s exports competitive in foreign markets. This is doubly true at a time when so many countries are attempting to cut production costs at the same time. Wage cuts do not reduce standards of living if they are accompanied by cuts in domestic prices. However, deflations have a tendency to make it more difficult for consumers and governments to pay off debts, which are mostly for a fixed amount of euros. Also, most deflationary policies tend to reduce economic growth and are appropriate only when the economy is booming and inflation is high. This is one of the key problems with the “new Keynesian” view—held by many economists—that rigid or “sticky” wages set in union contracts, etc., are a key cause of unemployment during business-cycle downturns.

There is much discussion of these issues on the web these days. Jeffrey Sommers and Michael Hudson, who holds an appointment at the Institute, have pointed out in a number of articles this year (such as this one) that the Latvian economic-policy model, which involved spending cuts and other efforts to regain competitiveness, has not been as popular in Latvia itself as some commentators have implied. Moreover, recent policies in Latvia have led to large-scale emigration, while failing to bring strong economic growth, in the aftermath of a 25 percent fall in output. (Latvia’s real exchange rate is among those shown in the chart above.) Charles Wyplosz analyzes data similar to those shown above and in Norris’s New York Times column and comes to the conclusion that differences in labor costs are fairly small—especially considering the likely accuracy of the data—and are not crucial to current problems in Europe. Last month, Alejandro Foxley of the Carnegie Endowment offered a more sanguine view than Sommers and Hudson of events in Latvia, while attributing many European problems to the rapid deregulation of financial markets and the rush to the adoption of the euro. He sees the latter process as having brought about an unsustainable boom in financial investment, property values, and consumption spending in many currently struggling economies.

We disagree with many of the arguments in these articles. They describe a situation that differs in many ways from the current one here in the United States. But the authors’ analyses are helpful to economists like me who lack intimate knowledge of the countries involved and their economic issues. While European countries should certainly not attempt to reduce wages across the board, policymakers there are in a position in which issues of excessive public debt are very real. Hence, the lessons for the United States, with its dollar-printing machine, are not always straightforward. But also, as the figure above suggests, the United States also has little reason to worry about excessive wages relative to those in the average industrialized country.

Update, April 25, approximately 8:10 am: I have revised the chart to include Canada, a major trading partner of the United States. Also, I made minor clarifying edits to the text used in the post and figure.
Comments


20th Annual Hyman P. Minsky Conference about to begin!

levyadmin | April 13, 2011

Many Levy Institute scholars and staff members are in New York City for this year’s conference on the late Institute scholar and author. Breakfast should be ending now, with the conference about to begin. The conference’s theme is “financial reform and the real economy.” More information about the conference, including the program, are available at the conference page on the Institute’s website.

Update, approximately 3 pm, April 13: The first audio from the conference has now been posted to this page on the Institute website. Now available there is audio from the conference’s formal opening and from the first session. You can choose among recordings of Leonardo Burlamaqui, Dimitri B. Papadimitriou, Jan Kregel, L. Randall Wray, and Eric Tymoigne. The conference ends this Friday, April 15.

Comments


Krugman, Galbraith, and others debate MMT

Greg Hannsgen | March 28, 2011

Paul Krugman slugs it out with our colleague Jamie Galbraith and many other “modern monetary theory” partisans at Krugman’s New York Times blog website. Jamie’s most recent retort is at the top of this page of the blog site. Many of the points raised in the discussion there are central to our work here at the Levy Institute and to the views of Galbraith and others in our macro research group.

Update: More links to the ongoing Krugman-MMT debate can be found here.  -G.H., March 31.

Update, August 11: Krugman on MMT again, this time drawing lessons from French fiscal policy between World Wars I and II.

Comments


How Tight Have ECB Policies Been in Real Terms?

Greg Hannsgen | March 24, 2011


(Click picture to enlarge.)

Readers may have seen two charts that are part of a column by David Wessel published last week. For five European countries, they compare actual interest rates with those prescribed by a standard policy rule. Wessel’s charts provide some interesting evidence that European Central Bank monetary policy has been either too loose or too tight most of the time for several currently ailing European economies, given these countries’ inflation rates and gaps between actual and potential output.  Wessel’s charts support the article’s theme, which is that severe economic problems in some Eurozone countries result in part from the “one-size-fits-all” interest rate policies of the ECB.

Along the same lines, at the top of this entry is a chart of short-term “real interest rates” faced by business borrowers who use overdraft loans in a group of European countries, which are mostly members of the euro area. I have used data on interest rates for this common type of loan, adjusting each month’s observation to reflect the same month’s measured consumer price inflation, so that the resulting “real rates” take into account inflation’s effects on the burden of loan payments. Inflation is helpful to debtors because it has the effect of reducing the amount of goods and services represented by each dollar owed under the terms of a loan. Of course, I have used only one of many possible methods that one could employ to approximate real interest rates.  Moreover, to construct a true real interest rate data series, one would need to know borrowers’ forecasts of the inflation rate, which is an impossible requirement in most circumstances. Hence, these series and others like them usually need to be taken with a grain of salt.

As theory would have it, real interest rates in different countries tend over the long run to converge on a common value, a result known as “real interest rate parity.” This convergence is assured only under certain exacting conditions that are clearly not met in the case of the numbers depicted in the chart. Nonetheless, the degree to which the rates differ may provide another indication of the disparities in credit costs that are imposed by a unified central banking system. Moreover, the chart shows that some of the countries now experiencing fiscal crises have been suffering the effects of particularly tight credit conditions. For example, Greece’s real interest rate was 20.49 percent in January, as indicated next to the green line representing the Greek data. Real rates for Ireland and Portugal, two other countries whose governments’ financial problems have recently been in the news, are also shown in the figure.

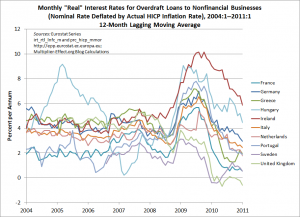
My next chart shows lines for all of the aforementioned countries, plus 7 others, containing points that are constructed by averaging the last 12 months’ observations from the first chart.  This removes most of the effects of regular seasonal patterns and helps to highlight longer-run trends, which would otherwise be obscured by the extreme volatility of these series. As a result, we are able to include data for 10 European nations in this figure.

(Click picture to enlarge.)

The data underlying the figures are harmonized European statistics, which are meant to be somewhat comparable across national boundaries. Nevertheless, the ten series in the figure seem to show no signs of converging, though their movements appear to be highly correlated over the past three years. According to the averaged data, Irish real interest rates have been the highest among the 10 European economies represented in the graph since approximately spring 2009. In January, the unaveraged real rate in Ireland exceeded 9 percent.

Like Wessel’s diagrams, the ones above show that despite centralized interest-rate setting, one measure of the tightness of policy for actual retail borrowers varies greatly across eurozone economies.

Notes:

continue reading…

Comments