Mandelbrot and the August S&P 500 close
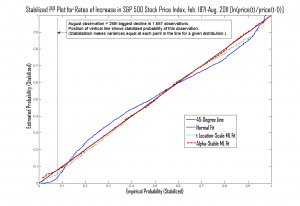
According to wsj.com, the S&P 500 stock price index stood at 1,218.89 at the close of the trading day on Wednesday afternoon, after a month that saw much turmoil in the financial markets. Combining monthly data from the website for Robert Shiller’s book Irrational Exuberance with the average unadjusted closing value for August (closes from Yahoo! Finance), last month’s percentage drop of –10.6 percent was the 26th largest in the 1,687-month period from February 1871 to August 2011. Shiller’s dataset includes some very large drops, including –26.5 percent for November 1929, the worst in the sample.
Some basic theories in finance rest upon the assumption that returns and/or changes in prices can be modeled as random draws from a normal distribution, the familiar bell-shaped curve used by statisticians. The late scientist and mathematician Benoît Mandelbrot showed that many financial data series had so many large increases and decreases that they could not be modeled in this way. (For a posthumous appreciation of Mandelbrot’s work, see science writer James Gleick’s article in the New York Times Magazine.) Mandelbrot hypothesized that many data sets could instead be modeled with the “heavy-tailed” distributions referred to as alpha-stable or stable-Paretian. These distributions allow for many “outliers,” or extreme observations.
The figure at the top of this post shows how well Shiller’s data fits a normal distribution (blue line), an alpha-stable distribution (red, dashed line), and a student’s-t distribution (green, dotted line), another statistical standby with fairly thick tails. In the figure, a line close to the diagonal black line indicates a good fit. As you can see, the two heavier-tailed distributions clearly provide better fits than the normal distribution.
Many authors, including Yves Smith in the book Econned (one bookseller’s site for the book is here), have argued that mathematical models utilizing normal distributions encouraged and/or rationalized excessive risk-taking in the financial sector in the run-up to the recent crisis. The experience of the past few years may have opened some eyes to the rather frequent big moves in various types of asset prices. The Wall Street Journal reported in 2009 that, in the wake of the crisis, more investors and traders on Wall Street have been using models that make use of heavy-tailed distributions. New rules for the financial sector are now being written in Washington. In drafting the new rules, I hope that Congress and the relevant government agencies are realistic about the high risk of big losses in many financial markets and activities. In general, one hopes that the excessive financial optimism studied by economists such as Shiller does not prevail in the rule-writing process.


 ShareThis