Dear Time Magazine Readers, the United States Is Not Insolvent
This is apparently the latest cover of Time magazine:
The idea that the US government or the nation as a whole is “insolvent” has an undying appeal. The fear of (or yearning for) some manner of budget crisis has waned somewhat over the last couple of years (one hopes this is due to the fact that most people alive today have never lived through a period in which the deficit has shrunk so rapidly), but stories like this will never go away.
The 25th Minsky conference wrapped up recently (video of all the speakers is posted here), and in one of the sessions Stephanie Kelton delivered a presentation in which she argued that, in contrast to almost any other area of policy, there is one issue on which Democrats and Republicans agree: a public debt crisis is looming. In addition to some disagreement over when the crisis will strike (hawks: yesterday; doves: in a decade or so), they differ merely on the question of how to solve this perceived problem: by cutting spending or raising revenue. This broader moment of bipartisan consensus, Kelton argued, is tarnished only by being wrong.
Among her efforts to dispel the appeal of the debt crisis narrative, Kelton pointed out that US government deficits are the mirror image of non-government surpluses (domestic private sector surpluses plus current account deficits), with a nod to what Goldman Sachs’ Jan Hatzius once described as “the world’s most important chart.” The upshot, she argued, is that calling for a reduction of public sector deficits in the presence of persistent current account deficits should be understood as calling for a reduction of the private sector’s surpluses. Kelton put together the following chart, which flips the script on the Simpson-Bowles-era discussions of how rapidly we should bring down the budget deficit:
“Ask the same question now. Now the graph doesn’t show the path of projected government deficits, but instead the path of projected non-government surpluses. So the question becomes how rapidly would you like to reduce the non-government surplus? You want to do it really quickly, follow the blue line; just bring surpluses down very sharply. Would you like to reduce the surpluses in the non-government sector more slowly, a more gradual approach. Or would you like to rethink this exercise all together because you think it’s madness that a policy objective is to reduce non-government surpluses? […]
In other words, their red ink is our black ink. And setting out to reduce budget deficits by $4.1 trillion over the next ten years is the same as saying my goal is to reduce the non-government surplus by 4.1 trillion over the next ten years. One might sound reasonable and the other sounds like madness, but it’s the same thing said two different ways.”
Watch her presentation (slides here):
Two other speakers at the conference mentioned a different, perfectly orthodox reason to stop worrying about a US public debt crisis. Even if you’re convinced that a debt ratio of the size predicted by the Congressional Budget Office’s long-run budget forecast represents a threat, there are reasons to doubt that we’re destined to reach that level.
One of the gimmicks used to channel budget hysteria into preexisting policy prescriptions is to describe “entitlements” as the major source of the debt crisis (step two: call for raising the full retirement age for Social Security, or some such). The problem with this approach, as many deficits doves have pointed out, is that there’s no such thing as a program called “entitlements” — the budget math behind Social Security and Medicare are quite different. Social Security features a fairly predictable rise in the gap between dedicated revenues and spending, due to demographics. For Medicare, the story is mainly about healthcare cost inflation. And now even that story is already out of date, given the recent slowdown in healthcare inflation. But there’s another factor. Whenever the CBO releases its budget outlook, look for the projected primary deficit 25 years out, or whenever is the relevant period about which we’re supposed to panic.
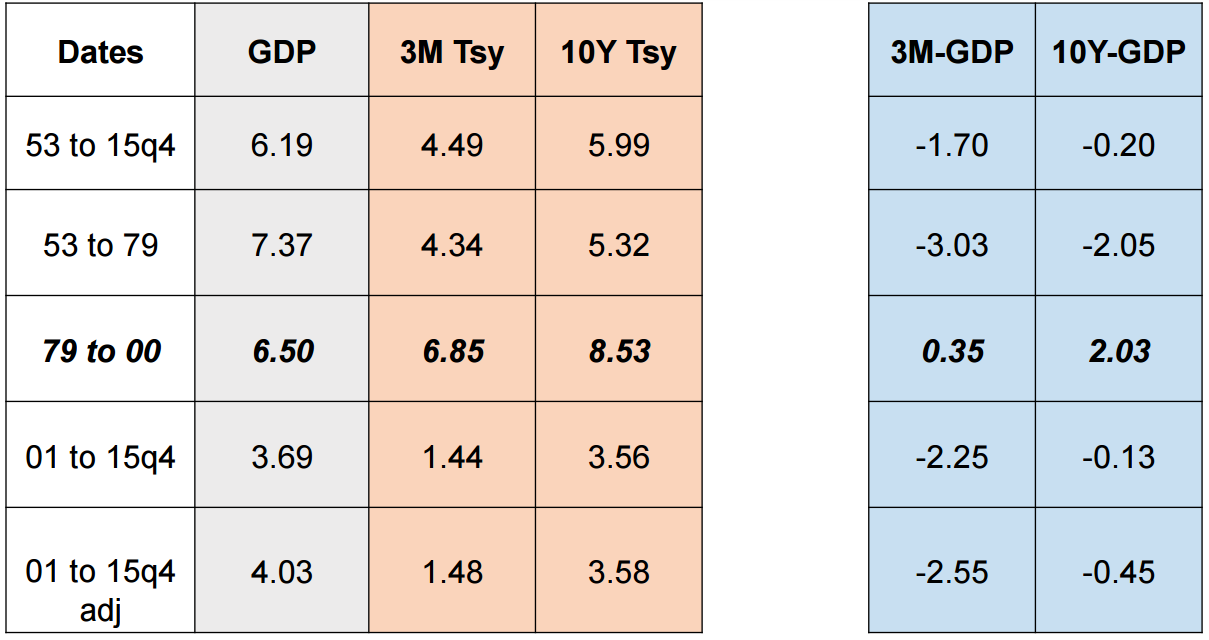
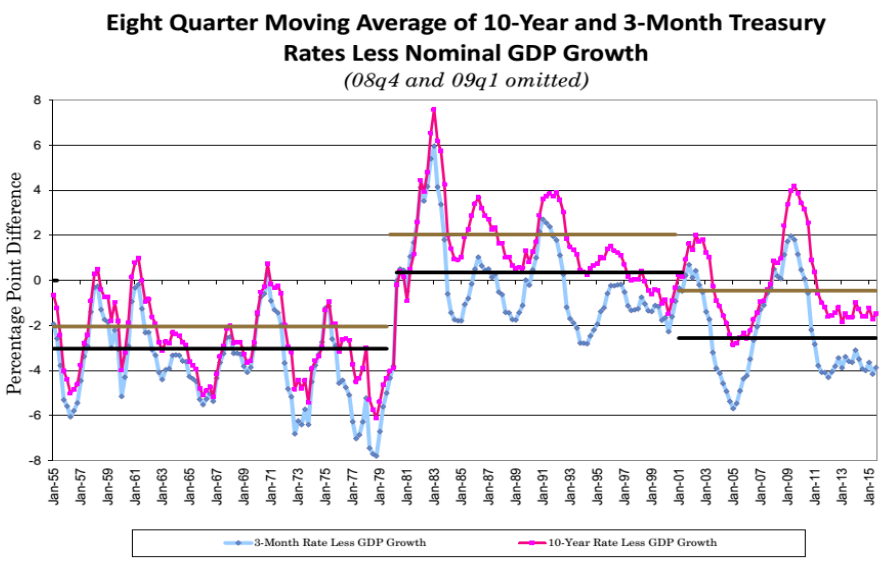
When you do this, you see that one of the last remaining foundations of the “debt crisis” story — that is, the prediction that public debt as a percentage of GDP will rise without limit — is the assumption about what will happen to interest rates, in relation to economic growth. Roughly speaking, if the interest rate on debt (r) is greater than the rate of GDP growth (g), the debt ratio will rise “unsustainably” (without limit). If, on the other hand, g > r, then even running a fairly healthy budget deficit every year is consistent with a stable or even falling debt ratio.
Looking at the historical data, Scott Fullwiler observed that the long-run historical average shows that g tends to be greater than r. The exception appears to be the 1979-2000 period (see Fullwiler’s charts below), “where the Fed … was most concerned about squeezing inflation out of the economy”:
“The interest rates on the national debt generally follow monetary policy, not the size of the deficits and things like that,” Fullwiler observed. “So what’s really normalization? Normalization is probably having the interest rate below GDP growth rather than necessarily moving back to a Taylor rule.”
And beyond the historical data, Bob Barbera argued earlier in the day that it’s hard to reconcile the CBO’s interest rate projections with what they are saying will happen to GDP growth and inflation over the same period (returning to a theme he discussed two Minsky conferences ago). Read this recent roundup by Barbera’s colleague Jon Faust. When you assume an interest rate more in line with the rest of the economic projections, Barbera pointed out, the popular story about ever-rising public debt fizzles out.


 ShareThis