Archive for the ‘Distribution’ Category

Is Inequality Holding Back the Recovery?

Michael Stephens | May 21, 2014

“The biggest obstacle to a sustainable recovery,” according to the Levy Institute’s newest strategic analysis of the US economy, “is the inequality in the distribution of income.”

In their latest, Dimitri Papadimitriou, Michalis Nikiforos, Gennaro Zezza, and Greg Hannsgen begin with a familiar point: the Congressional Budget Office has been predicting fairly rosy economic growth rates for the coming years (rising to 3.4 percent in 2015 and ‘16)—rosy, that is, given the CBO’s expectation that government budgets will remain tight, and get even tighter, over this period (with the federal budget deficit shrinking to 2.6 percent of GDP by 2015).

As Papadimitriou et al. point out, the only way to make these growth and budget forecasts both come true, assuming there are no significant changes in net exports (a safe assumption), is if the private sector substantially increases its indebtedness. There really isn’t any other option. If we don’t see a return to ballooning private debt-to-income ratios, then either government budgets will have to be loosened or we won’t get the growth rates the CBO is telling us to expect.

Now, there are reasons to think that the reappearance of accelerated growth in private debt is unlikely (a theme the authors dealt with in their last US strategic analysis), but if it does happen, rising private debt ratios—which played the starring role in the financial crisis from which we’re still recovering—might destabilize the financial system. This is one sense in which maintaining tight government budgets over the next several years should not be portrayed, as it all-too-often is, as the “prudent” course of action.

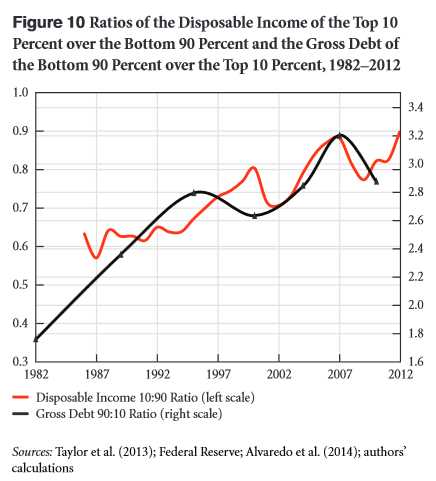
And the widening of income inequality over the last few decades makes these dynamics even more problematic. As the authors point out, the trend of rising inequality has gone hand-in-hand with mounting indebtedness among households in the bottom 90 percent of the income distribution:

[O]ver the last 30 years not only was there a sharp increase in the level of household debt but a disproportionate share of this debt was incurred by the middle class and the poorest American households. Moreover, there seems to be a strong correlation between the two variables: as the disposable income of the top 10 percent of the population increased relative to the disposable income of the bottom 90 percent, the gross debt of the latter rose relative to the debt of the former.

Fig 10_Ratios of Disposable Income and Gross Debt_Levy Institute Strategic Analysis

Going forward, the current stance of public policy (including, but not limited to, tight fiscal policy) de facto requires a rise in household debt—borne entirely by the bottom 90 percent of households—as the only path to modest economic growth rates (in the range of CBO’s 3.1–3.4 percent). If, on the other hand, the bottom 90 percent of US households continue to “deleverage,” lowering their debt loads, then the authors show that we’re more likely to see economic growth fall to a piddling 1.7 percent by 2017, with unemployment rising to 7.6 percent.

In other words, absent a change in policy aimed at loosening the government budget or increasing net exports (perhaps through targeted R&D investment), the US economy is facing one of two outcomes: “a prolonged period of low growth—secular stagnation—or a bubble-fueled expansion that will end with a serious financial and economic crisis.”

“The only way out of this dilemma,” they conclude, “is a reversal of the trend toward greater income inequality. A change in the income distribution is a necessary condition for sustainable growth in the future.”

Read the report: Is Rising Inequality a Hindrance to the US Economic Recovery?

Comments


Phillips Curve Still Alive for Compensation?

Greg Hannsgen | May 13, 2014

wage_phillips_curve

On reading a recent post by Ed Dolan at Economonitor with some evidence of the lack of a strong Phillips relationship for consumer-price inflation in US data, it occurred to me to try a measure of total compensation per hour with recent data. The wage relationship estimated over all available quarters, using averaged monthly observations for the civilian unemployment rate, is shown above, with a scatter plot and an estimated regression line. Like the relationship estimated by Dolan, the regression line above suffers from a rather loose fit (constant: 6.87; slope coefficient: -.29; R-squared = .02). A complete explanation of inflation is complicated and of course also involves other costs, including raw materials such as fuel. The latter costs are subject of course to “cost-push”-type inflation at times, as are wages. Exchange rates of course affect these costs.

A time series graph below displays both series over the entire sample period, 1948q1 to 2014q1. As some have observed, the exceedingly high unemployment rates of the post-financial-crisis era (blue line) have resulted in very weak or negative compensation growth rates (red line). The latter are not adjusted for inflation in the figures, since we are focusing on nominal data in this post.  The downward trend in nominal wage growth in the right side of the figure (red line) helps to explain recent declines in the so-called wage share, which measures the fraction of national income going to labor costs. (However, see this New York Times article for some evidence that falling unemployment is beginning to bring some inflation-adjusted wage growth to parts of the US.)

wage-Phillips time series

By the way, if inflation were to become a large problem (and it seems well-contained now), non-recessionary methods exist to try to alleviate it. Even where the Phillips-curve relationship is strong, the human costs of using it to combat inflation are usually very high, given the existence of alternative policies that could perhaps be given a try in the US.

Comments


Distribution, Stagnation, and Macro Policy in an Interactive Model

Greg Hannsgen | April 21, 2014

The funny-shaped surface in the Wolfram “CDF” below (software download link) depicts excess demand for goods. The flat one represents the zero line where supply and demand are equal. On each axis is a variable that affects the degree to which demand outpaces or falls short of supply: (1) firms’ share in the price of goods, after paying wages, which equals the pricing markup m divided by (1 + m); and  (2) the income and production generated by the private sector, measured by capacity utilization. The height dimension measures excess demand for goods.

The sliding levers at the top of the CDF allow one to change (1) (“chi”) the percentage of disposable income spent by the wealthy households who own most stock, as well as all government-issued securities; (2) the rate of production by the public sector, which hires workers to produce services; and/or (3) the annual compound real interest rate (yield) on government securities. All of the other parameters are held constant as you move the levers. Click on the “plus” sign next to a lever, and further information appears.

[WolframCDF source=”http://multiplier-effect.org/files/2014/04/3D-excess-demand-graphN5.cdf” width=”331″ height=”361″ altimage=”3D-excess-demand-graphN5.png” altimagewidth=”309″ altimageheight=”351″]

Click here for a much larger, easier-to-read version of this CDF on a webpage of its own.

At the curved line where the two surfaces intersect (the edge of the dark blue region when viewed from above), aggregate demand is just equal to private-sector output, and there is no tendency for capacity utilization to change. Finding this intersection gives us the set of combinations of output and the distributional parameter at which all newly produced units are being sold, and no new goods orders are stacking up unfilled. Experimenting with the CDF, one finds that capacity utilization is usually higher: (1) when the share of the “K-sector”, or capital-owning sector, (m/(1 + m)) is lower, (2) when that sector spends a greater percentage of its disposable income, or (3) when government production and payrolls are larger.

One should keep in mind the simplification required to construct such a “small” model, which in graphical form represents only an imaginary economy; the numbers are not intended to mirror those of any particular country or data set–but the economic  system portrayed in the CDF is meant to be similar in many of its essentials to that of large industrialized nations with their own currencies, huge companies, liquid securities markets, floating exchange rates, etc. Another possible way to interpret this highly “stratified” industrial system is as an entire global economy in a mere 3 sectors: workers; firms/wealthy households; and government/central bank.

A larger version of the model featured an unemployment benefits system. To come: a discussion of the movements over time that may or may not bring the economy closer to the line where excess demand just reaches the flat surface and no higher. The model still has only a rudimentary financial system, with no private borrowing. Hence, the interest rate lever acts upon the economy solely by changing the amount of interest payments from the government to households–a distributional and fiscal variable in its own right and an MMT insight. (Business investment depends on capacity utilization and the gross after-tax profit rate.) The model is drawn more or less directly from Levy Institute working paper 723 (see this previous post) as revised recently for the academic journal Metroeconomica.

Comments


Galbraith on Piketty’s “Capital”

Michael Stephens | March 27, 2014

From Senior Scholar James Galbraith’s review of Thomas Piketty’s much-discussed Capital in the Twenty-First Century:

Although Thomas Piketty, a professor at the Paris School of Economics, has written a massive book entitled Capital in the Twenty-First Century, he explicitly (and rather caustically) rejects the Marxist view. He is in some respects a skeptic of modern mainstream economics, but he sees capital (in principle) as an agglomeration of physical objects, in line with the neoclassical theory. And so he must face the question of how to count up capital-as-a-quantity.

His approach is in two parts. First, he conflates physical capital equipment with all forms of money-valued wealth, including land and housing, whether that wealth is in productive use or not. He excludes only what neoclassical economists call “human capital,” presumably because it can’t be bought and sold. Then he estimates the market value of that wealth. His measure of capital is not physical but financial.

This, I fear, is a source of terrible confusion. […]

Piketty wants to provide a theory relevant to growth, which requires physical capital as its input. And yet he deploys an empirical measure that is unrelated to productive physical capital and whose dollar value depends, in part, on the return on capital. Where does the rate of return come from? Piketty never says. He merely asserts that the return on capital has usually averaged a certain value, say 5 percent on land in the nineteenth century, and higher in the twentieth.

The basic neoclassical theory holds that the rate of return on capital depends on its (marginal) productivity. In that case, we must be thinking of physical capital—and this (again) appears to be Piketty’s view. But the effort to build a theory of physical capital with a technological rate-of-return collapsed long ago, under a withering challenge from critics based in Cambridge, England in the 1950s and 1960s, notably Joan Robinson, Piero Sraffa, and Luigi Pasinetti.

Read the rest at Dissent magazine.

Comments


Minsky on the War on Poverty

Michael Stephens | January 10, 2014

Roughly a year after President Johnson used the occasion of his first State of the Union address to declare war on poverty, Hyman Minsky presented a paper on the subject at a conference in Berkeley. Here’s what he wrote:

The war against poverty is a conservative rebuttal to an ancient challenge of the radicals, that capitalism necessarily generates “poverty in the midst of plenty.” This war intends to eliminate poverty by changing people, rather than the economy. Thus the emphasis, even in the Job Corps, is upon training or indoctrination to work rather than on the job and the task to be performed. However, this approach, standing by itself, cannot end poverty. All it can do is give the present poor a better chance at the jobs that exist: it can spread poverty more fairly. A necessary ingredient of any war against poverty is a program of job creation; and it has never been shown that a thorough program of job creation, taking people as they are, will not, by itself, eliminate a large part of the poverty that exists.

The war against poverty cannot be taken seriously as long as the Administration and the Congress tolerate a 5 percent unemployment rate and frame monetary and fiscal policy with a target of eventually achieving a 4 percent unemployment rate. Only if there are more jobs than available workers over a broad spectrum of occupations and locations can we hope to make a dent on poverty by way of income from employment. To achieve and sustain tight labor markets in the United States requires bolder, more imaginative, and more consistent use of expansionary monetary and fiscal policy to create jobs than we have witnessed to date. …

The single most important step toward ending poverty in America would be the achieving and sustaining of tight full employment. Tight full employment exists when over a broad cross-section of occupations, industries, and locations, employers, at going wages and salaries, would prefer to employ more workers than they in fact do. Tight full employment is vital for an anti-poverty campaign. It not only will eliminate that poverty which is solely due to unemployment, but, by setting off market processes which tend to raise low wages faster than high wages, it will in time greatly diminish the poverty due to low incomes from jobs.

Ending Poverty_cover

Comments


The Next Bubble?

Gennaro Zezza | December 2, 2013

Is the U.S. economy heading towards another bubble? Since last week, the number of commentators on this subject has been growing, from Robert Shiller to Nouriel Roubini (on housing markets).

In our first chart we report the Standard & Poor’s 500 stock market index, normalized by a consumer price index to remove the common trend in prices. Our measure has increased by 105.6 percent from its most recent bottom in March 2009. In the previous rally, which started from a bottom value in February 2003, the index increased by only 63 percent before the start of a rapid descent in July 2007.

US_SP500_index

Is a buoyant stock market justified by expected profitability? In the next chart, we report gross saving of non-financial corporations – that is, undistributed profits gross of capital consumption – scaled by GDP, along with gross investment (which includes changes in inventories). All figures are computed from the Integrated Macroeconomic Accounts published by the B.E.A.

The chart clearly shows that profits have reached an all-time high at 11.5 percent of GDP, compared to an average of 9 percent over the 1960-2007 period. If current profits are the basis for expected future profitability, our data suggest that the stock market rally is justified. But is this trend stable and sustainable?

US_CorporateProfits

The chart also shows what we may call an investment gap. While profits and investment have usually moved in line, it was usually the case that investment exceeded retained profits. But since the second half of 2008, profits have soared while investment dropped, opening a gap which is currently over 2 percent of GDP. A low level of investment is not a good sign for future growth.

What are companies doing with such exceptional profits? In the next chart we add U.S. foreign direct investment (FDI) made abroad to domestic investment in our previous chart (while at the same time switching to moving averages to reduce the volatility of quarterly FDI).

US_Investment+FDI

The new chart is suggesting that foreign direct investment is a major destination for retained profits, and that FDI did not suffer the same downturn seen in domestic investment during the last recession.

Data from the B.E.A. on the composition and direction of U.S. FDI show it is difficult to evaluate where U.S. foreign direct investment is directed. While data for FDI in manufacturing show the emerging role of China as recipient of U.S. FDI, its weight is still below 5 percent of total FDI in manufacturing. Besides, the share of manufacturing in total FDI in 2012 is only 14 percent, while multinational companies, classified as “Holding Companies (non bank)” in B.E.A. statistics, account for almost 44 percent of total FDI in 2012. Countries receiving FDI in this grouping seem to be financial centers: the Netherlands (25.6 percent), Luxembourg (15.5 percent), Bermuda (11.2 percent), and the U.K. (10.7 percent).

Summing up, our findings suggest that U.S. non-financial corporations are in a healthy state – as measured by their net profits – but that this will not necessarily imply stronger U.S. growth and job creation. On the contrary, the data are coherent with a further increase in the concentration of income leading to financial speculation, in the U.S. as well as in foreign financial markets.

Restoring jobs and prosperity in the U.S. does not seem to be what U.S. corporations are working towards, and yes, the soaring stock market may change course very quickly, if “financial markets” make this decision.

Restoring sustainable growth in the U.S. (and elsewhere) requires a reversal of the trend in income distribution, since, as Stockhammer reminds us, “rising inequality has increased the propensity to speculate as richer households tend to hold riskier financial assets than other groups,” and “higher inequality has led to higher household debt as working class families have tried to keep up with social consumption norms despite stagnating or falling real wages” – a fact we already investigated a few years ago.

Comments


The Long Battle for a Living Wage Goes On

Pavlina Tcherneva | September 2, 2013

(cross-posted from ineteconomics.org)

This week workers in fast food restaurants across the country gathered to protest the minimum wage in the United States, which currently is a paltry $7.25, and to fight for a better standard of living. The battle for a living wage for the nation’s poorest workers is set against the backdrop of mass unemployment and the highest level of economic inequality in the U.S. in almost a century.

The first minimum wage laws in the U.S. were the result of a state-by-state effort in the Progressive era to secure a floor to a decent life to employed women and youth. The first of these was enacted in Massachusetts in 1912 and eventually led to the 1938 Fair Labor Standards Act, which instituted a minimum wage at the federal level.

The objective was fairness, economics opportunity, stability, and social cohesion. The problem was the unequal power between labor and capital—a rationale that even early neoclassical economists embraced on the grounds that it constrained labor’s bargaining power and reduced morale, productivity, and wellbeing.

The solution was to set the “rules of the game” so that working women could support their families and young workers would not fall prey to discriminatory practices of their employers. In the absence of such rules, economists thought, the market mechanism wouldn’t work. Firms simply could not be counted on to self-regulate or reinforce these rules. The minimum wage movement required legislation.

The Supreme Court initially resisted and ruled that the state laws were unconstitutional, but states and organized labor prevailed, and by the time the New Deal rolled around, the Supreme Court had changed its mind. It had begun to work with a much broader definition of “the public interest” and supported various state legislations to protect the “welfare of its citizens.” It was understood that the wellbeing of workers served an important public purpose.

American economists – neoclassical and institutionalists alike – all supported the movement, the legislation, and the rationale. This wonderful excursion in the history of the minimum wage movement and the history of economic thought by Robert Prasch (1999) shows that economists in the U.S. were virtually unanimous in their support. The objections largely came from the British, notably from Professor Pigou, until another British economist, John Maynard Keynes, disproved his argument. Not only were the assumptions behind the labor market mechanism unfounded in Pigou’s analysis, but the notion that the minimum wage caused unemployment was also theoretically and empirically flawed. As Keynes explained, reducing wages as a macroeconomic policy was a “method socially disastrous in the process and socially unjust in the result.”

A federally mandated minimum wage was not enough to secure fairness, economic opportunity, stability, and social cohesion. The missing piece was a policy for full employment – one that guaranteed jobs for all who wished to work. That came later with the work of John Maynard Keynes, John Pierson, William Beveridge, and others. All advanced specific policies for full employment that aimed to secure decent work at decent pay to anyone who was ready, willing, and able, regardless of whether the economy was reeling from a Great Depression or enjoying relative prosperity. The right to work was codified by the international community in the 1948 Universal Declaration of Human Rights and found a special place in Martin Luther King, Jr.’s “I Have a Dream” speech during the 1963 March on Washington for Jobs and Freedom.

The New Deal put full employment front and center on the policy agenda. Though it did not deliver a long-term job guarantee program, it boldly and successfully experimented with direct employment policies. The war mobilization delivered true full employment, but Keynes insisted that public policy could and ought to achieve the same in peacetime.

In 1949, the minimum wage nearly doubled at a time when the economy was as close to true full employment as it has ever been, and when direct job creation was the policy of choice to deal with unemployment. Full employment and high wages ushered in the Golden Age of the American economy.

Today we have neither. Mainstream economists have successfully convinced themselves and policy makers that true full employment is impossible and that the minimum wage is the root of all evil.

Jobs for all (via a Full Employment Program through Social Entrepreneurship, a Green Jobs Corp, or a Job Guarantee) and a doubling of the minimum wage is what the economy needs today. Keynes made the case, Martin Luther King, Jr. made the case, and the international community made the case.

Sometimes the good old ideas are the best new ideas.

Follow me on Twitter at @ptcherneva

Comments


QE vs the Recovery Act: How Does Our Approach to Stimulus Affect Inequality?

Michael Stephens | June 6, 2013

Annie Lowrey recently renewed the ongoing discussion over whether the Federal Reserve’s attempts at reviving the economy through quantitative easing (QE) are exacerbating inequality.  The abbreviated version of the argument is that QE operates mainly through boosting asset prices, leading to gains in stocks and housing that largely benefit those at the top.  If that’s the case (Lowrey quotes Josh Bivens suggesting that one would also have to weigh any potential reductions in the unemployment rate from the Fed’s easing), it’s bad news for those who care about inequality, because for the next three years, monetary stimulus is the only game in town (it will be interesting to see whether Republicans continue to be skeptical of fiscal stimulus if they win the White House in 2016).

Turning to fiscal policy, Ajit Zacharias, Tom Masterson, and Kijong Kim did a preliminary estimate (pdf) of the likely distributional impacts of the American Recovery and Reinvestment Act (ARRA).  They found that the Recovery Act would have a positive impact on employment (largely “palliative,” given the rapid rate of job loss at the time) and little overall effect on inequality.  A fiscal stimulus skewed more toward expenditure and less dominated by tax cuts than the Recovery Act could have a greater positive impact for low-income households and individuals.

This is particularly the case if those expenditures come in the form of direct job creation — and even more so if we also consider projects in areas beyond infrastructure and green energy.  Along with Rania Antonopoulos, Zacharias, Masterson, and Kim studied (pdf) the potential benefits of a direct job creation program in the social care sector (early childhood education and home-based care).  They found that such a program would not only have a greater employment impact when compared to investment in infrastructure, but would also be particularly beneficial for households at the bottom of the income distribution.

PPB 108_Figure 3

Comments


What Is “Time Poverty” and Why Should You Care?

Michael Stephens | June 5, 2013

This is how we came up with the official poverty line for the United States, back in the early 1960s:  essentially, we put together a very basic diet, figured out the monetary value, and multiplied by three.  If a family has less income than that number, adjusted for inflation, they’re poor.

There are numerous problems with this measure, and the Census Bureau has since come up with an alternative, the Supplemental Poverty Measure (SPM), which they started reporting in 2011.  But there’s one very important item that’s left out of both the official and supplemental poverty measures:  time.  What does time have to do with poverty, you might ask?  The extent to which you find yourself tempted to ask that question is partly a reflection of how much we still take unpaid work and its products for granted in economic analysis, and more generally.

Many of the products of household labor, like edible meals and basic healthcare and sanitation, are among those things absolutely essential to attaining a bare bones standard of wellbeing.  Providing these products and services in adequate amounts takes time.  If we don’t have the time to do this work ourselves, it’s often possible to buy substitutes on the market (housekeeping, day care, and so on), but either the time for unpaid work or the money to purchase substitutes needs to be accounted for.  The outputs of unpaid household work can’t simply be taken for granted when we’re trying to measure people’s ability to secure the basics.  Yet all around the world, we do just that when we put together our official poverty statistics.

A research team led by Ajit Zacharias, Rania Antonopoulos, and Thomas Masterson has been examining how the depth and breadth of poverty change when we take the demands of unpaid work seriously — how this changes who is counted as poor, and how poor they are considered to be.  Their alternative measure is called “LIMTIP,” the Levy Institute Measure of Time and Income Poverty.  In a recent interview, Rania Antonopoulos explained why LIMTIP is a crucial tool for figuring out how widely our formal and informal economies are delivering a meaningful chance at a decent life: continue reading…

Comments


Safety Nets vs Economic Empowerment

Michael Stephens | May 21, 2013

There are important changes in how many developing countries are approaching the problem of poverty. Specifically in the area of “social protection” policy — policies intended to prevent or alleviate income insecurity and poverty — these changes are reflected in attempts to move beyond one-off interventions and “safety nets” to policies designed to address some of the underlying problems causing economic vulnerability in the first place.

In a new policy brief, developed with support from the United Nations Development Programme, Rania Antonopoulos considers how women’s economic empowerment can be advanced in the context of this evolution in social protection policy.  She zeroes in on the ways in which social protection policies, while addressing income gaps, also shape women’s opportunities through the manner in which these programs “see” or “position” women (whether intentionally or not).  To explain how this “positioning” works, she points to three different policies for addressing food insecurity (all targeted at women): cash transfers, free delivery of food staples, and access to land plus subsidized seed and fertilizer.  While all these interventions are aimed at reducing food insecurity, Antonopoulos observes that “there are stark differences between them in terms of the process through which deprivation is addressed, and from a gender perspective, differences in the (implicitly) assigned positioning of the beneficiary”:

The first addresses income poverty by enabling women to participate in the economy as consumers, which they otherwise cannot do on their own. The second, in the case of free rationed food, allocates food directly to those deserving of support because of their destitute status and inability to cope. The third approach addresses the income gap through means that enable the beneficiary to engage in the economy as a producer.While all three reduce an identified deprivation, the last one acknowledges it as an outcome of social relations of exclusion in production (i.e., women farmers do not have access to necessary agricultural inputs and support systems) that often underpin people’s experiences of chronic poverty and vulnerability.

While Antonopoulos stresses that there is no one-size-fits-all approach that follows from these observations, these “positioning” dynamics should inform program design:  social protection instruments can reinforce gender inequalities, or leave them untouched, but they also offer the potential to help promote women’s roles as active participants in economic life. continue reading…

Comments